Table of Contents
Introduction: Global Energy and the New Power Reality
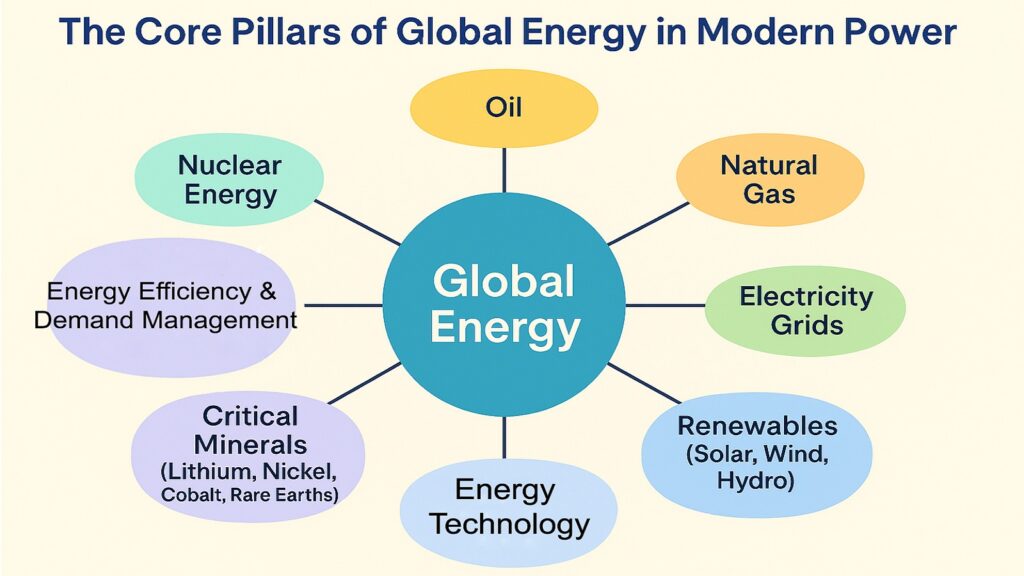
Global Energy encompasses the production, distribution, and consumption of power resources that fuel modern civilization. It includes fossil fuels like oil, natural gas, and coal, alongside renewable sources such as solar, wind, hydroelectric, and nuclear power. These resources no longer function merely as commodities. They operate as instruments of economic authority and diplomatic leverage.
Nations now treat energy as a tradable currency. They weaponize it during conflicts. They depend on it for survival. This transformation has elevated Global Energy from a technical concern to a central pillar of geopolitical strategy. Understanding these dynamics matters because energy access determines which economies flourish and which falter.
In 2024, global energy demand reached 592 exajoules, marking an all-time high. Fossil fuels still supplied 86.7 percent of this total, though renewable sources grew seven percent year-over-year. Asia Pacific drove 68 percent of demand growth, reflecting rapid industrialization.
The relationship between Global Energy and economic prosperity runs deep. Countries with reliable power access attract investment, build industries, and improve living standards. Those without face persistent poverty and instability.
Global Energy’s Interconnections with The Building Blocks of the Global Economy
| Building Blocks Of Gobal Economy | Relationship with Global Energy |
|---|---|
| Global Trade | Energy costs affect shipping routes and manufacturing competitiveness. Oil flows through maritime chokepoints determined 20 percent of global petroleum consumption in 2024. |
| Global Financial Systems | Energy prices influence inflation, currency valuations, and investment flows. Markets treat energy security as a systemic risk factor. |
| Global Tech Innovation | Advanced energy systems require sophisticated grids and AI management. Patent filings for grid innovations grew sixfold between 2010 and 2022. |
| Global Supply Chains | Manufacturing depends on consistent power. Energy shortages cost affected regions up to six percent of GDP during 2021. |
| Labor Migration | Energy access creates jobs while energy poverty drives migration seeking economic opportunity. |
| Governance and Institutions | Energy policy requires coordination through organizations like OPEC and IEA. Institutional strength determines negotiating power. |
| Geopolitics | Control over energy shapes military alliances and conflicts. Russia’s 2022 gas cuts to Europe demonstrated energy as a geopolitical weapon. |
| Demographics | Population growth increases demand. Emerging markets face incomplete electricity access despite growing populations. |
| Climate and Sustainability | Energy production generates most global carbon emissions. Climate policies reshape which nations gain advantage in future systems. |
Six critical risks now threaten to reshape how power flows between nations. These dangers extend beyond simple supply disruptions. They challenge fundamental assumptions about energy security and international cooperation.
1. Global Energy and the Risk of Fragmented Alliances
Traditional alliances built on shared ideology are fracturing under energy pressures. Nations now realign based on pipeline access, supply security, and fuel affordability. This pragmatic reordering creates unstable partnerships that shift with market conditions.
Europe’s relationship with Russia exemplifies this fragmentation. For decades, Germany and other European Union members imported Russian natural gas through long-term contracts. The 2022 Ukraine invasion shattered this arrangement. Europe scrambled to find alternative suppliers while Russia redirected exports toward Asia.
The United States positioned itself as a liquefied natural gas exporter to replace Russian supplies. Yet this substitution created complications. European nations now depend on trans-Atlantic shipping routes vulnerable to disruption. Price volatility increased as spot markets replaced stable contracts.
China’s energy diplomacy illustrates how supply needs override other considerations. Despite Western sanctions against Russia, China increased imports of Russian oil and gas. These purchases provided Moscow with vital revenue while giving Beijing discounted energy.
India demonstrates how energy pragmatism reshapes foreign policy. Despite participating in the Quad security partnership with the United States, India dramatically increased Russian oil imports after 2022. The country’s energy needs overrode pressure to join Western sanctions.
Key Examples of Alliance Shifts Driven by Global Energy
| Alliance Transformation | Drivers of Global Energy |
|---|---|
| Europe Pivoting from Russia | After Russia cut supplies in 2022, Europe sought alternatives. Investment in import terminals exceeded 184 billion dollars through 2030. |
| China-Russia Partnership | Power of Siberia pipeline delivers 38 billion cubic meters annually, cementing Moscow-Beijing ties despite ideological differences. |
| Gulf States Courting Asia | Saudi Arabia’s oil exports to Asia reached 60 percent of total output by 2024, shifting from traditional Western customers. |
| US-Mexico-Canada Integration | North American cooperation intensified under USMCA. Canada’s clean energy investment reached 27 billion Canadian dollars. |
| India’s Multi-Alignment | India imported discounted Russian crude while maintaining Gulf partnerships and exploring domestic renewables. |
| Turkey’s Gas Transit Leverage | Turkey controls Bosporus Strait through which 40 percent of Russian crude transited in 2024, enhancing Ankara’s position. |
The fragmentation extends to renewable energy development. China dominates solar panel manufacturing, controlling 35 percent of global planned capacity. European and American efforts to build domestic production create competing supply chains.
The instability inherent in energy-driven alliances creates risks for all participants. Partnerships based purely on supply needs lack resilience when conditions change. This volatility makes long-term planning difficult and increases the likelihood of conflicts.
2. Global Energy and the Rise of Pipeline Diplomacy
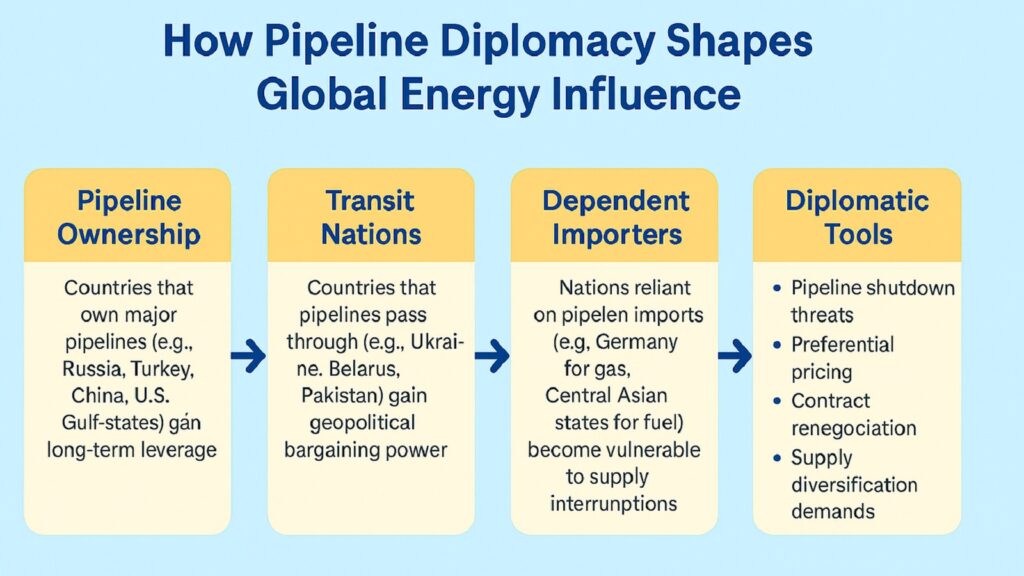
Pipelines have evolved from infrastructure into instruments of statecraft. Control over these routes allows countries to negotiate, pressure, or reward others. The physical geography of global energy distribution now shapes diplomatic relationships as much as any treaty.
Russia pioneered modern pipeline diplomacy through its gas network across Europe. The Nord Stream projects aimed to bypass Ukraine while deepening German dependence on Russian supplies. These pipelines represented a strategy to maintain influence through energy ties.
The Dolphin Pipeline connecting Qatar to the United Arab Emirates and Oman demonstrates cooperation within the Gulf Cooperation Council. This system enables regional energy sharing while reducing dependence on global markets.
Central Asia’s pipeline networks illustrate how geography constrains options. Kazakhstan, Turkmenistan, and Uzbekistan possess substantial gas reserves but limited export routes. The competition between Russia and China for Central Asian energy creates opportunities for producing nations.
The Trans-Adriatic Pipeline carries Azerbaijani gas through Greece and Albania to Italy. This route reduces European dependence on Russian supplies while rewarding Azerbaijan with export revenue.
Pipeline diplomacy extends to blocking or threatening routes. Turkey’s control over potential paths for Caspian energy to Europe gives Ankara substantial leverage. These chokepoint positions allow relatively small nations to extract concessions from larger powers.
Major Pipeline Projects Shaping Global Energy Diplomacy
| Pipeline System | Diplomatic Significance |
|---|---|
| Power of Siberia | Delivers 38 billion cubic meters annually to China. Secured Russia’s eastern pivot after Western sanctions. Cost exceeded 55 billion dollars. |
| Trans-Adriatic Pipeline | Connects Azerbaijan’s Shah Deniz field to Italy. Reduces European Russian dependence. Capacity reached 10 billion cubic meters. |
| Nord Stream | Bypassed Ukraine transit route. Nord Stream 2 became political flashpoint. Both pipelines now idle, representing strategic failure. |
| Southern Gas Corridor | Multi-pipeline system from Caspian to Europe. Length exceeds 3,500 kilometers, delivering 16 billion cubic meters annually. |
| Dolphin Pipeline | First regional gas pipeline in Gulf Cooperation Council. Connects Qatar’s North Field to UAE and Oman. |
| East Mediterranean Pipeline | Proposed route connecting Israeli and Cypriot offshore fields to Greece against Turkish opposition. |
Proposed pipelines that never materialize still shape diplomacy. The Nabucco project aimed to bring Caspian gas to Europe without Russian involvement. Though abandoned, the concept influenced thinking about diversification.
Pipeline maintenance creates ongoing dependencies. Once built, infrastructure requires continuous cooperation to function. Technical disruptions can occur for genuine reasons or serve as covers for political pressure.
The future of pipeline diplomacy faces uncertainty from energy transition pressures. Long-term gas infrastructure requires decades to recoup investment. Climate policies threaten to strand these assets before their useful life ends.
3. Global Energy and Vulnerable Supply Corridors
Maritime chokepoints concentrate Global Energy flows into narrow passages where disruption creates cascading effects across world markets. These corridors serve as arteries for the oil and gas trade. Any blockage threatens to destabilize entire economies within days.
The Strait of Hormuz stands as the world’s most critical energy chokepoint. In 2024, approximately 20 million barrels per day transited this passage. That volume represented one-fifth of global petroleum consumption. Around 20 percent of the liquefied natural gas trade also passed through Hormuz.
Any closure of Hormuz would immediately remove a significant supply from global markets. Alternative routes exist, but cannot handle the volume. The East-West pipeline across Saudi Arabia can bypass Hormuz for some Saudi crude, but alternatives move perhaps 5 million barrels daily.
The Strait of Malacca channels most Middle Eastern energy exports to Asia. In 2024, approximately 24 million barrels per day of oil and gas flowed through this passage. China accounts for 50 percent of crude imports through Malacca.
The Bab el-Mandeb Strait links the Red Sea to the Gulf of Aden. Prior to the onset of Houthi attacks in December 2023, approximately 12 percent of the world’s maritime trade transited through this critical chokepoint. The assaults on commercial ships compelled shipping firms to divert their routes around Africa’s Cape of Good Hope, resulting in extended transit times by several weeks.
Critical Maritime Chokepoints for Global Energy Flows
| Chokepoint Locations of Global Energy Flow | Strategic Vulnerability |
|---|---|
| Strait of Hormuz | Transited 20 million barrels daily in 2024, representing 25 percent of seaborne oil trade. Iran could threaten closure during conflict. |
| Strait of Malacca | Handled 24 million barrels per day. Narrowest point measures 1.5 nautical miles. Piracy incidents surged to 80 in first half of 2025. |
| Bab el-Mandeb | Houthi attacks beginning December 2023 forced 50 percent traffic reduction. Alternative Cape route adds 10 days and substantial costs. |
| Suez Canal | Carried 11 percent of global maritime oil trade before Bab el-Mandeb crisis. Ever Given blockage in 2021 demonstrated system fragility. |
| Turkish Straits | Russia moved 40 percent of crude exports through Bosporus in 2024. Turkey controls access between Black Sea and Mediterranean. |
| Cape of Good Hope | Traffic grew 50 percent to 8.7 million barrels daily in 2024. Offers security but adds expense. Forty percent heads to China. |
Climate change adds new dimensions to the chokepoint vulnerabilities. Extreme weather events increase in frequency and severity. Droughts affect canal water levels. These physical risks compound geopolitical dangers.
Protecting these corridors requires substantial military capabilities. The United States maintains a naval presence in key regions. Yet no nation can guarantee an uninterrupted flow through all chokepoints simultaneously.
4. Global Energy and the Battle for Storage Dominance
Energy storage technologies determine who controls power systems of the future. Battery capacity, hydrogen storage, and strategic reserves shape reliability and geopolitical influence. Nations investing in storage infrastructure gain decisive advantages as renewable energy expands.
Lithium-ion batteries dominate current storage markets. Global battery storage capacity in the power sector reached 85 gigawatts by 2023. That figure grew to approximately 160 gigawatts by the end of 2024, representing a 55 percent year-over-year increase.
China commands battery manufacturing and deployment. In 2024, China accounted for 36 gigawatts of new battery installations, far exceeding other nations. The country shipped 93.5 percent of global energy-storage batteries. China’s production costs run roughly 20 percent below European competitors.
The United States expanded battery storage to over 26 gigawatts by the end of 2024, a 66 percent increase from 2023. California leads with 12.5 gigawatts of installed capacity. These deployments support renewable energy integration as solar and wind generation grow.
Battery costs have declined dramatically, enabling widespread adoption. Lithium-ion prices dropped from 1,400 dollars per kilowatt-hour in 2010 to under 140 dollars in 2023. Some 2024 Chinese bids reached 66 dollars per kilowatt-hour for utility-scale projects.
Leadership in Global Energy Storage Technologies
| Global Energy Storage Leadership Area | Current Status and Implications |
|---|---|
| Battery Manufacturing | China produces 70 percent of global lithium-ion cells. CATL alone commands 38 percent market share with 20 percent cost advantage. |
| Utility-Scale Deployment | United States reached 26 gigawatts capacity in 2024. California’s 12.5 gigawatts enables solar integration and grid stability. |
| Cost Reduction | Lithium-ion prices fell from 1,400 dollars per kilowatt-hour in 2010 to under 140 dollars in 2023. Chinese projects bid 66 dollars. |
| Critical Material Control | China refines 60 percent of lithium, 70 percent of cobalt, and 90 percent of rare earth metals creating supply chain concentration. |
| Hydrogen Storage Potential | Hydrogen offers long-duration storage exceeding battery capabilities but commercial scale remains years away. |
| Strategic Reserve Capacity | United States holds 700 million barrel Strategic Petroleum Reserve. China building strategic reserves providing emergency buffers. |
Hydrogen presents an alternative to battery storage for certain applications. Hydrogen can store energy for longer durations than current battery technology allows. Yet hydrogen storage faces substantial challenges, including significant energy input for production.
Strategic petroleum reserves offer another storage dimension. The United States maintains a 700 million barrel Strategic Petroleum Reserve. This inventory provides an emergency supply during disruptions.
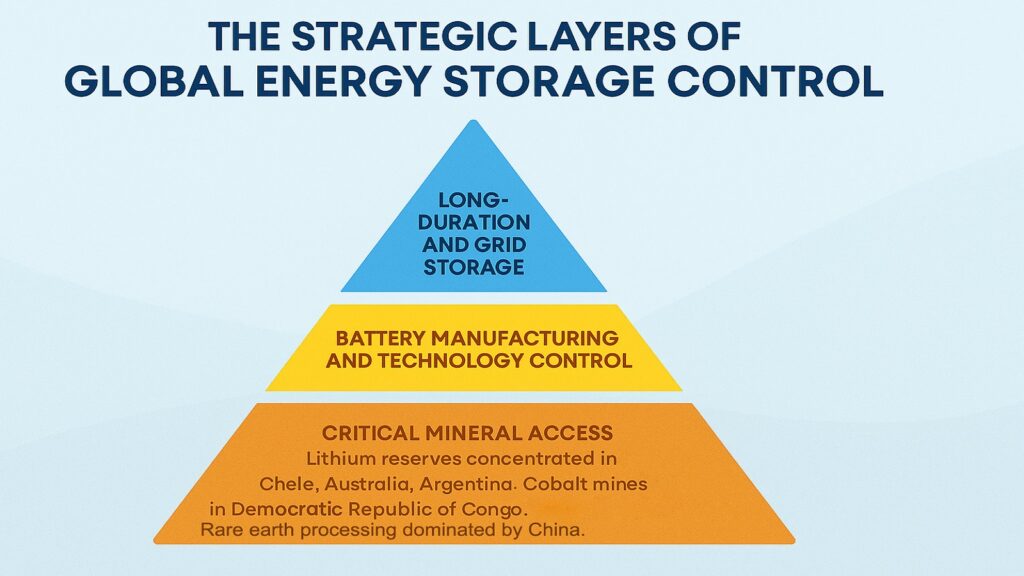
Control over critical battery materials shapes storage dominance. Lithium, cobalt, nickel, and graphite supplies constrain battery production. China refines 60 percent of lithium and 70 percent of cobalt globally. The Democratic Republic of Congo produces 70 percent of the world’s cobalt.
Resource nationalism in mineral-producing countries threatens supply stability. Chile, Bolivia, and Argentina form the lithium triangle containing 65 percent of known lithium reserves. Chile nationalized its lithium industry in 2023.
5. Global Energy and the Technology Inequality Gap
Advanced power grids, smart distribution systems, and artificial intelligence separate technological leaders from laggards. This gap widens the divide between tech-rich and tech-poor nations. Access to and control of Global Energy increasingly depend on digital capabilities.
Smart grid technologies enable efficient matching of electricity supply with demand in real time. Digital technologies can reduce grid investment needs by an estimated 1.8 trillion dollars globally through 2050 through improved maintenance.
Grid digitalization patents have surged in recent years. Patent filings for electricity grid technologies grew sixfold between 2010 and 2022. China’s share rose from 7 percent in 2013 to 25 percent in 2022, overtaking the European Union.
Artificial intelligence integration into power systems creates substantial advantages. AI can enhance forecasting accuracy by up to 20 percent compared to traditional methods. Grid optimization using AI reduces energy losses by 10 to 15 percent.
Yet AI deployment requires adequate data infrastructure and technical expertise. Developing countries face significant barriers. Incomplete or inaccurate data compromises AI effectiveness.
Global Disparities in Energy Technology Capabilities
| Technology Gap Area | Impact on Global Energy Access |
|---|---|
| Smart Grid Deployment | European Commission projects 584 billion euros for electricity grid through 2030. China plans 442 billion dollars. Developing nations lack resources. |
| AI Grid Management | US and China lead AI integration. Developing countries struggle with data quality needed for effective AI systems. |
| Digital Infrastructure | Emerging markets need 33 billion dollars additional annual grid investment to reach net-zero trajectory. Current investment falls short. |
| Technical Expertise | Implementing smart grids requires skilled personnel. Developing countries face critical shortages exacerbated by brain drain. |
| Renewable Integration | Advanced grids handle variable solar and wind generation. Poor infrastructure limits renewable deployment in developing countries. |
| Cyber Security | Digital grids face hacking risks. Developed nations invest heavily in protection while developing countries lack adequate resources. |
Investment levels reveal the growing technology divide. Annual grid investment needs to reach 750 billion dollars by 2030 to achieve global net-zero emissions targets. Current investment stands at around 330 billion dollars annually.
Sub-Saharan Africa exemplifies the consequences of the technology gap. In 2021, backup generators in the region produced more electricity than all renewable energy sources combined. Unreliable grids impose GDP losses up to 6 percent in some countries.
Smart meters provide fundamental data for modern energy management. In Europe, 13 of 27 European Union countries are progressing toward smart meter goals. Eleven countries have barely started or lack plans entirely.
Training and capacity building lag behind technology deployment needs. Developing countries require skilled technicians to operate and maintain advanced systems. Brain drain to developed nations compounds shortages.
6. Global Energy and the Escalation of Resource Nationalism
Governments worldwide are asserting greater control over energy resources and critical minerals. Export restrictions, stockpiling, and protective policies aim to secure domestic supply and maximize economic benefits. These measures reshape global markets and create ripple effects across international trade.
Resource nationalism has intensified as the clean energy transition increases demand for specific minerals. Lithium, cobalt, nickel, graphite, and rare earth elements are essential for batteries, wind turbines, solar panels, and electric vehicles.
Chile controls the world’s largest lithium reserves. In 2023, Chile announced its National Lithium Strategy, requiring government participation in all new lithium projects. This policy discouraged some foreign investors.
Indonesia implemented export bans on nickel ore, requiring domestic processing. A World Trade Organization panel ruled these measures contravened international trade obligations. Regardless of legal status, Indonesia forces companies to invest in local processing facilities.
Recent Resource Nationalism Measures in Global Energy
| Country and Measure | Strategic Objective and Market Impact |
|---|---|
| Chile Lithium Nationalization | Government participation mandatory in new projects. Aims to capture value from 65 percent of global lithium reserves. |
| Indonesia Nickel Export Ban | Prohibits unprocessed nickel ore exports. WTO panel ruled measures violate trade obligations but policy continues. |
| Tanzania Mineral Reform | Reforms covering 40 critical minerals. Requires local value addition plan forcing companies to invest in processing. |
| Zimbabwe and Namibia Restrictions | Both countries banned exports of unprocessed minerals including lithium and transition minerals. |
| China Rare Earth Export Controls | December 2024 restrictions on rare earth exports. China refines 60 percent of lithium, 70 percent of cobalt, 90 percent of rare earths. |
| Russia Strategic Stockpiling | Building reserves of oil, gas, and critical minerals to buffer against Western sanctions and maintain export leverage. |
Tanzania introduced sweeping reforms covering 40 critical minerals. The policy requires local value addition plans for any medium or large-scale mining license. Companies must invest in domestic processing rather than simply extracting raw materials.
China maintains a dominant position in critical mineral processing. China refines 60 percent of lithium, 70 percent of cobalt, and 90 percent of rare earth metals globally. This downstream control provides Beijing with leverage independent of mining operations.
In December 2024, China announced restrictions on exports of several rare earth materials. This move demonstrated how processing dominance translates into geopolitical power.
As mentioned earlier, the Democratic Republic of Congo supplies 70 percent of the world’s cobalt production. Political instability and governance challenges complicate extraction. Resource nationalism manifests through changing tax regimes and ownership requirements.
The resource nationalism trend creates several consequences. Foreign investment may decline if policies appear unpredictable. Mining companies require long time horizons and stable regulatory environments. Yet producing countries argue they deserve larger shares of profits from their resources.
Conclusion: Global Energy and the Future of Power Balance
These six critical risks are reshaping which nations gain economic advantage and diplomatic influence. Energy security no longer depends simply on possessing resources. It requires controlling supply routes, deploying advanced technologies, building storage capacity, and maintaining stable alliances.
Fragmented alliances mean traditional partnerships offer less reliability than before. Energy pragmatism overrides ideological alignment. Nations must cultivate multiple relationships to ensure supply diversity. Pipeline diplomacy gives geographic chokepoint countries outsized influence. Control over transit routes provides leverage far exceeding their economic or military power. Vulnerable supply corridors concentrate risk into narrow passages where disruption cascades globally. Protecting these chokepoints requires substantial military capabilities. Diversification of routes and suppliers offers the only hedge.
Storage dominance is shifting power toward nations investing in battery manufacturing and critical mineral processing. China’s commanding position in both areas positions Beijing favorably for the renewable energy era.
The technology inequality gap threatens to permanently divide nations into energy haves and have-nots. Countries lacking digital infrastructure will struggle to integrate renewable energy regardless of natural resource endowments. Resource nationalism reflects legitimate desires by producing nations to capture more value from their assets. Yet excessive restrictions risk fragmenting global markets and reducing overall efficiency.
The future belongs to nations that recognize energy as the foundation of power in the twenty-first century. Understanding Global Energy dynamics is no longer optional for leaders, businesses, or citizens. Preparing for this future requires investment, planning, and difficult choices. Short-term costs must be weighed against long-term security. International cooperation must balance with the protection of national interests.
The six critical risks outlined here will not resolve themselves. They will intensify as global energy demand grows and climate pressures mount. How governments respond will determine the shape of the global order for generations. Energy security is national security. Energy access is an economic opportunity. Energy leadership is geopolitical influence.
Strategic Imperatives for Navigating Global Energy Volatility
| Strategic Priority | Implementation Requirements |
|---|---|
| Supply Chain Diversification | Countries must develop multiple supplier relationships. Dependence on single sources creates vulnerability to disruption. |
| Technology Capability Building | Advanced grids, storage, and AI management determine future leadership. Developing nations need assistance closing technology gaps. |
| Critical Mineral Security | Lithium, cobalt, nickel, and rare earths drive future energy systems. Countries must secure access through partnerships or domestic development. |
| Infrastructure Resilience | Chokepoint vulnerabilities require alternative routes and redundant capacity. Investment in pipeline diversity and maritime protection essential. |
| Diplomatic Flexibility | Energy pragmatism demands ability to shift partnerships quickly. Multi-alignment strategies provide negotiating leverage and alternatives. |
| Resource Governance Frameworks | International cooperation on critical minerals needed. Trade frameworks must accommodate sovereignty while maintaining efficiency. |