
Table of Contents
Introduction: Global Market Indices as the Invisible Architecture of Markets
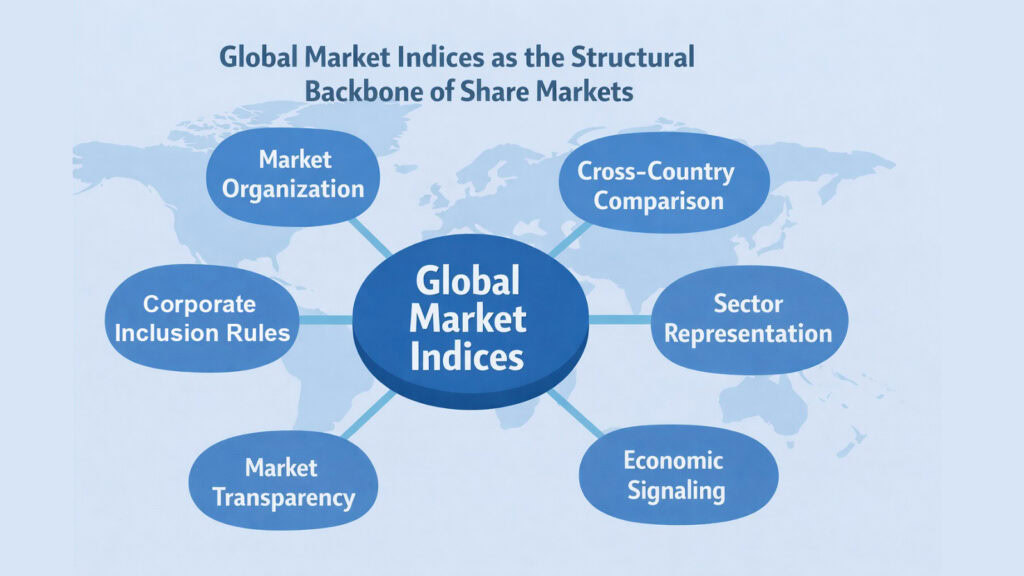
Most conversations about markets revolve around movement. Prices rise, fall, surge, or collapse. Headlines announce gains and losses. Investors watch tickers. Yet beneath this visible drama lies something quieter and more structural. Global Market Indices serve as the foundational architecture organizing share markets across continents. They are not merely numbers flickering on screens in New York, London, Mumbai, Shanghai, or Tokyo. They are carefully constructed frameworks that shape how economies are perceived, compared, and understood.
These indices operate across the USA, UK, Europe, India, China, Japan, and dozens of other regions. Each follows distinct rules, reflects different economic priorities, and serves varied purposes. Most discussions focus on what indices do, tracking their daily shifts and monthly trends. Far fewer examine how they are built, maintained, and governed. This gap matters because structure determines meaning. The architecture of an index influences which companies gain visibility, how capital flows are interpreted, and what narratives emerge about entire economies.
This article explores the invisible forces shaping Global Market Indices. It examines selection rules, weighting systems, rebalancing processes, sector representation, governance frameworks, and inherent limitations. The focus remains analytical and system-oriented. No investment advice appears here, no suggestions about buying shares, no recommendations about market timing. Instead, the aim is to reveal how these indices function as interpretive tools that organize complexity into comparable forms.
Table 1: Global Market Indices Compared with Other Key Components of Share Markets
| Component | Primary Function |
|---|---|
| Global Market Indices | Organize and represent market performance through selected portfolios of securities |
| Stock Exchanges | Provide regulated platforms where securities are listed and traded between buyers and sellers |
| Listed Companies | Issue shares to raise capital and provide ownership stakes to investors |
| Investors and Traders | Allocate capital by buying and selling securities based on research and strategy |
| Brokers and Intermediaries | Facilitate transactions between buyers and sellers while ensuring regulatory compliance |
| Regulators | Establish rules, monitor compliance, and maintain market integrity and investor protection |
| Instruments | Include equity shares, bonds, derivatives, and other financial products available for trading |
| Clearing & Settlement System | Process and finalize transactions, transfer ownership, and manage counterparty risk |
1. Global Market Indices and the Power of Selection Rules
Every index begins with exclusion. Before any constituent enters, selection rules determine eligibility. These criteria act as filters, separating companies that qualify from those that do not. Market size often stands as the first barrier. An index tracking large corporations sets minimum thresholds for market capitalization, ensuring only enterprises above a certain scale gain entry. Liquidity requirements follow, demanding sufficient trading volume so that buying and selling can occur without dramatic price distortion.
Listing history matters too. Many Global Market Indices require companies to maintain a public listing for a minimum period before consideration. This filters out recent entrants whose stability remains unproven. Regulatory compliance forms another layer, with indices often excluding companies facing serious legal challenges or failing to meet disclosure standards. Some indices apply geographic restrictions, requiring headquarters or primary operations within specific regions.
Different markets apply these rules differently. Mature economies with deep capital markets often set higher thresholds, reflecting abundance. Emerging markets may lower barriers to ensure adequate representation. The USA employs strict liquidity standards for its major indices. India incorporates free-float market capitalization, accounting for shares actually available for trading rather than total outstanding shares. Japan emphasizes sector diversity alongside size, while China navigates the complexity of A-shares, B-shares, and offshore listings.
Selection rules shape identity. An index focused on blue-chip companies tells one story about an economy. An index capturing mid-sized enterprises tells another. Neither story is complete, but each reveals something structural about market composition and economic priorities. The rules themselves carry embedded assumptions about what matters: stability over innovation, size over growth potential, and established presence over emerging promise.
Table 2: Global Market Indices and Their Selection Criteria Across Regions
| Region/Market | Key Selection Criteria Applied |
|---|---|
| USA | Minimum market cap thresholds, high liquidity requirements, exchange listing duration, sector representation balance |
| Europe | Market cap and liquidity filters, free-float adjustments, multi-country listings coordination, regulatory compliance standards |
| India | Free-float market capitalization, minimum six-month listing history, trading frequency requirements, volatility limits |
| China | Distinctions between A-shares and offshore listings, government ownership considerations, trading volume thresholds, sector classifications |
| Japan | Market cap combined with sector diversity goals, liquidity measured by trading value, stability of financial reporting, Tokyo Stock Exchange tier listings |
| Emerging Markets Indices | Lower market cap thresholds to ensure representation, emphasis on regulatory environment stability, currency accessibility, foreign ownership allowances |
2. Global Market Indices and the Weighting Systems That Shape Influence
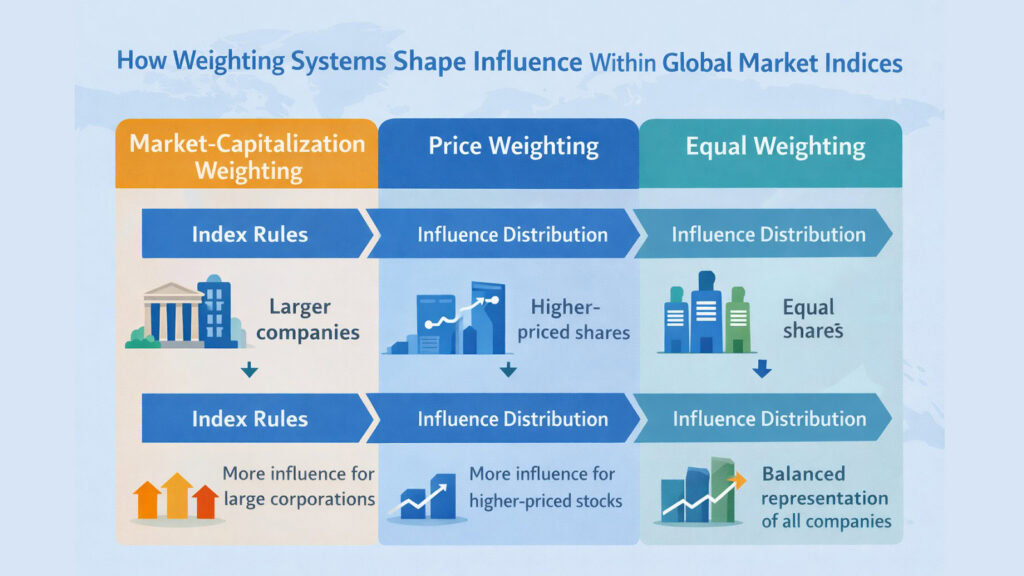
Once selected, companies do not stand equal within an index. Weighting systems assign different degrees of influence. These choices determine which constituents dominate index movements and which fade into background noise. Three primary approaches govern most Global Market Indices: market-cap weighting, price weighting, and equal weighting. Each reflects different assumptions about what constitutes fair representation.
Market-cap weighting ties influence to company size. A corporation worth one trillion dollars receives proportionally greater weight than one worth ten billion. This method mirrors economic reality in one sense, giving larger enterprises more voice because they command more capital. The S&P 500 follows this logic, as do most major indices worldwide. When technology giants grow, their expanding market caps automatically increase their index influence without any committee decision.
Price weighting takes a different path. It assigns influence based on share price rather than total company value. The Dow Jones Industrial Average famously uses this approach. A stock trading at three hundred dollars per share carries more weight than one trading at fifty dollars, regardless of overall company size. This creates peculiar distortions but maintains simplicity and historical continuity.
Equal weighting offers a third option, giving every constituent an identical influence regardless of size or price. This approach requires more frequent rebalancing since market movements constantly shift the balance. It emphasizes breadth over concentration, ensuring smaller companies have voices comparable to giants. Some specialized indices adopt this method to avoid domination by a few massive firms.
Regional traditions influence these choices. American indices pioneered market-cap weighting as markets grew enormous. European indices often blend approaches, reflecting diverse national markets with varying depths. Asian indices sometimes incorporate liquidity weighting, acknowledging that trading volume matters as much as nominal size. The weighting system shapes what an index reveals about an economy. Market-cap weighted indices highlight corporate concentration. Equal-weighted indices emphasize diversity.
Table 3: Global Market Indices Weighting Methods and Their Regional Applications
| Weighting Methods of Global Market Indices | Operational Logic and Regional Examples |
|---|---|
| Market-Cap Weighting | Companies weighted by total market value; used by S&P 500, FTSE 100, Nifty 50, and most modern broad indices globally |
| Free-Float Market-Cap | Weights based on publicly tradable shares only; widely adopted across European indices, Indian indices, and international standards |
| Price Weighting | Influence determined by nominal share price; seen in Dow Jones Industrial Average and Nikkei 225 |
| Equal Weighting | All constituents receive identical weight; used in specialized indices focusing on balanced representation rather than size dominance |
| Liquidity Weighting | Trading volume and ease of transaction influence weight; sometimes incorporated in emerging market indices where liquidity varies dramatically |
| Fundamental Weighting | Based on financial metrics like revenue or earnings rather than market price; experimental approach used by some alternative indices |
3. Global Market Indices and the Role of Periodic Rebalancing
Markets move. Companies grow, shrink, merge, split, or disappear entirely. Without adjustment, any index would drift from its original purpose, becoming a historical artifact rather than a current representation. Rebalancing addresses this inevitable decay. It is maintenance work, necessary but often invisible to casual observers.
Rebalancing occurs on fixed schedules. Some Global Market Indices review constituents quarterly. Others operate on annual cycles. During these reviews, committees evaluate whether existing members still meet selection criteria and whether new candidates deserve inclusion. A company that has grown might rise from a mid-cap to a large-cap index. Another facing sustained decline might drop out entirely. Mergers force immediate adjustments as two entities become one.
Weight adjustments happen more frequently than constituent changes. As share prices fluctuate, market-cap weighted indices see automatic shifts in influence. A stock doubling in price doubles its weight without intervention. But extreme movements trigger deliberate rebalancing to prevent single companies from dominating. Free-float adjustments also require periodic updates as insider holdings change or new shares enter circulation.
The process aims for stability, not reaction. Indices generally avoid responding to short-term volatility or temporary disruptions. Buffer zones prevent companies from bouncing in and out across threshold boundaries. A stock might need to fall below a minimum threshold and stay there for multiple review periods before removal occurs. This dampens turnover and reduces the costs imposed on funds tracking the index.
Different regions handle rebalancing with varying philosophies. American indices tend toward systematic rules with limited discretion. European approaches often incorporate more committee judgment, balancing quantitative triggers with qualitative assessment. Asian indices sometimes face unique challenges when state-owned enterprises undergo gradual privatization, requiring nuanced decisions about when changing ownership merits reweighting.
Table 4: Global Market Indices Rebalancing Practices Across Different Systems
| Rebalancing Aspects of Global Market Indices | Implementation Approach |
|---|---|
| Review Frequency | Ranges from quarterly reviews for dynamic indices to annual assessments for stable benchmarks |
| Constituent Changes | Triggered by threshold breaches, mergers, delistings, or failure to maintain minimum criteria over sustained periods |
| Weight Adjustments | Market-cap indices adjust continuously through price changes; formal rebalancing corrects extreme concentrations or incorporates free-float changes |
| Buffer Mechanisms | Ranking buffers prevent borderline companies from cycling in and out; reduces transaction costs for tracking funds |
| Emergency Adjustments | Immediate changes for corporate actions like mergers, bankruptcies, or regulatory suspensions that cannot wait for scheduled reviews |
| Transparency Requirements | Most major indices publish detailed methodology documents and announce changes with advance notice to minimize market disruption |
4. Global Market Indices and Sector Representation Across Economies
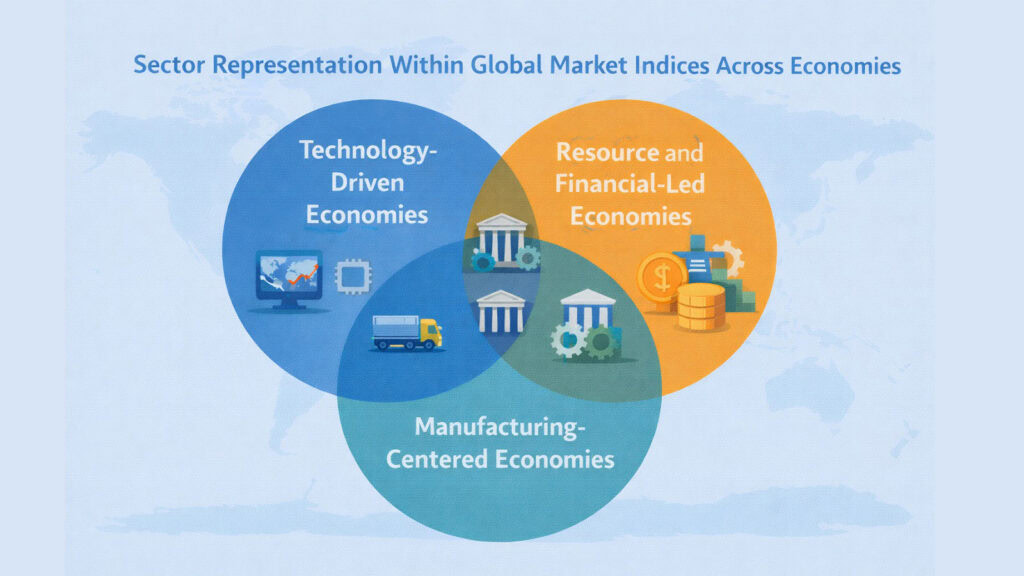
Economies differ. Some nations built wealth through manufacturing. Others through natural resources, financial services, or technological innovation. Global Market Indices reflect these structural differences through sector composition. An index dominated by technology firms tells a different story than one heavy with energy companies or financial institutions.
The USA showcases technology concentration. Major American indices carry substantial weight in information technology, communication services, and consumer discretionary sectors. This mirrors decades of innovation in Silicon Valley and beyond, where companies like those focused on software, semiconductors, and digital platforms grew to enormous scale. The sector mix reflects American economic evolution from industrial manufacturing toward knowledge-based industries.
Europe presents different patterns. Financial services often claim significant portions of major European indices, alongside industrials and consumer goods. Banking giants, insurance companies, and asset managers hold prominent positions. Manufacturing remains important, particularly in German indices where automotive and industrial machinery companies maintain a strong presence. The sector balance reflects Europe’s diversified industrial base and global financial center status.
India shows heavy financial sector representation combined with growing technology services. Banks, insurance companies, and financial institutions dominate major Indian indices alongside information technology firms providing outsourcing and software services globally. Energy and materials sectors also feature prominently, reflecting domestic consumption needs and industrial development priorities.
China faces unique composition challenges. State-owned enterprises span multiple sectors, creating concentrations in financials, energy, and telecommunications. Technology companies have grown rapidly but often list offshore, fragmenting representation across different index families. The sector mix reflects state economic planning alongside market forces, creating patterns distinct from purely market-driven compositions.
Japan demonstrates mature industrial diversity with strong representation in manufacturing, particularly automotive and electronics, alongside trading companies and financial institutions. The sector balance reflects Japan’s post-war industrial development and its role as a major exporter of manufactured goods and technology products.
Table 5: Global Market Indices Sector Concentration by Economic Region
| Region | Dominant Sectors Represented |
|---|---|
| USA Indices | Information technology and communication services lead, followed by healthcare, financials, and consumer discretionary sectors |
| European Indices | Financials, industrials, and consumer goods show strong presence; healthcare and energy vary by country; luxury brands notable in French indices |
| Indian Indices | Financial services dominate alongside information technology services; energy, materials, and consumer goods comprise secondary representation |
| Chinese Indices | Financials heavily weighted due to state banks; technology growing but split between domestic and offshore listings; energy and materials significant |
| Japanese Indices | Industrial manufacturing including automotive and electronics; trading companies unique to Japan; financials and consumer goods balanced |
| Emerging Markets Aggregate | Financials typically largest sector; materials and energy prominent due to resource economies; technology presence varies widely by country |
5. Global Market Indices and Governance Behind the Scenes
Indices require stewardship. Decisions about selection, weighting, and rebalancing cannot be arbitrary or capricious. Governance structures provide the oversight ensuring consistency, transparency, and credibility. These frameworks operate largely invisibly, yet they determine whether markets trust an index as a legitimate representation.
Index committees form the core governance mechanism. These bodies typically include experts in market structure, economics, and regional specialization. Committee members review methodology, evaluate constituent changes, and resolve edge cases where rules provide insufficient guidance. Most major Global Market Indices maintain standing committees that meet on regular schedules, often quarterly or monthly, depending on index complexity.
Methodology documents serve as constitutional texts. These detailed publications specify every rule governing index construction and maintenance. They define selection criteria, explain weighting approaches, outline rebalancing schedules, and describe decision-making processes. Transparency here builds confidence that indices follow stated rules rather than hidden agendas. When methodologies change, advance notice typically gives market participants time to adjust.
Review cycles ensure continuous improvement. Governance frameworks require periodic examination of whether existing rules still serve their intended purposes. Market evolution sometimes renders old criteria obsolete or creates gaps in coverage. Committees propose methodology updates, often with public comment periods allowing stakeholders to provide feedback before implementation.
Different regions emphasize different governance aspects. American index providers tend toward highly rules-based approaches with minimal discretion, reducing concerns about favoritism or manipulation. European governance often incorporates more committee judgment, particularly when dealing with complex cross-border situations. Asian indices sometimes navigate relationships with government stakeholders, requiring delicate balancing between independence and cooperation.
Conflicts of interest receive careful attention. Major index providers maintain separation between index governance and other business lines. Committee members typically cannot hold positions that would create incentives to favor particular constituents. Disclosure requirements ensure any potential conflicts become visible. These safeguards matter because indices influence substantial capital flows, creating incentives for manipulation if governance fails.
Table 6: Global Market Indices Governance Structures and Oversight Mechanisms
| Governance Elements of Global Market Indices | Implementation and Purpose |
|---|---|
| Index Committees | Standing expert panels that review methodology, evaluate constituent changes, and ensure consistent application of rules |
| Methodology Documentation | Detailed public documents specifying all construction and maintenance rules; updated with advance notice when changes occur |
| Review and Consultation Processes | Periodic methodology reviews with stakeholder feedback periods before implementing significant changes |
| Independence Standards | Separation between index governance and commercial interests; conflict of interest policies for committee members |
| Announcement Protocols | Advance notice of constituent changes and rebalancing actions; typically days or weeks before implementation to allow market adjustment |
| Audit and Compliance Functions | Internal oversight ensuring actual index operation matches published methodology; external reviews for major indices |
6. Global Market Indices and Their Built-In Limitations
Every simplification excludes. Global Market Indices compress economic complexity into trackable portfolios, but this compression inevitably omits. Understanding these gaps matters as much as understanding what indices capture. The limitations are not flaws but rather trade-offs inherent to creating comparable, standardized representations.
Size thresholds exclude most companies. Indices focusing on large corporations miss the vast universe of smaller enterprises driving employment, innovation, and regional growth. A country might have thousands of listed companies, but only fifty in its flagship index. The excluded majority often includes dynamic smaller firms, family businesses going public, and regional players lacking national scale. Their absence means indices reveal less about entrepreneurial activity or small-business health.
Unlisted economies remain invisible. Private companies, state-owned enterprises not publicly traded, and informal sector activities generate enormous economic value but escape index representation. Some nations have vibrant private sectors dwarfing public markets. Others maintain significant state ownership outside listed markets. Indices measure only the publicly traded slice, leaving vast economic territories unmapped.
Geographic concentration creates distortions. National indices typically emphasize companies headquartered domestically, even when their operations span globally. A multinational corporation might appear in one country’s index while generating most revenue elsewhere. This complicates the interpretation of what an index actually represents about domestic economic activity versus global business operations based in particular legal jurisdictions.
Sector gaps emerge from listing patterns. Not all industries favor public markets. Some sectors raise capital privately, through family ownership, or via state financing. Technology startups might stay private longer than previous generations. Infrastructure often remains government-controlled. These patterns mean certain economic activities get overrepresented in indices while others barely register.
Liquidity requirements filter out legitimate companies. Firms with concentrated ownership or limited free-float might meet size criteria but fail liquidity tests. This particularly affects markets where controlling shareholders are common or where stock market culture emphasizes long-term holding over active trading. The most stable companies might paradoxically struggle to meet trading volume thresholds.
Temporal limitations affect representation. Indices capture current states, not transitions or futures. A declining industry might dominate today’s index while tomorrow’s growth sectors remain small or unlisted. This backward-looking bias means indices often reflect past economic success more clearly than emerging transformations.
Table 7: Global Market Indices Inherent Limitations and Coverage Gaps
| Limitation Type | Specific Gaps Created by Global Market Indices |
|---|---|
| Size Thresholds | Exclude smaller companies, mid-sized enterprises, and regional players lacking national scale; miss entrepreneurial activity |
| Listing Requirements | Omit private companies, family-held businesses, and state-owned enterprises not publicly traded despite economic significance |
| Geographic Boundaries | Attribute multinational corporations to single countries based on legal domicile rather than actual operational footprint |
| Sector Coverage Bias | Underrepresent industries that favor private ownership, government control, or alternative capital sources over public equity markets |
| Liquidity Filters | Exclude thinly traded stocks and companies with concentrated ownership despite meeting size criteria |
| Temporal Lag | Reflect current and historical economic structures more clearly than emerging transformations or future growth sectors |
Conclusion: Global Market Indices as Tools for Understanding, Not Judgment
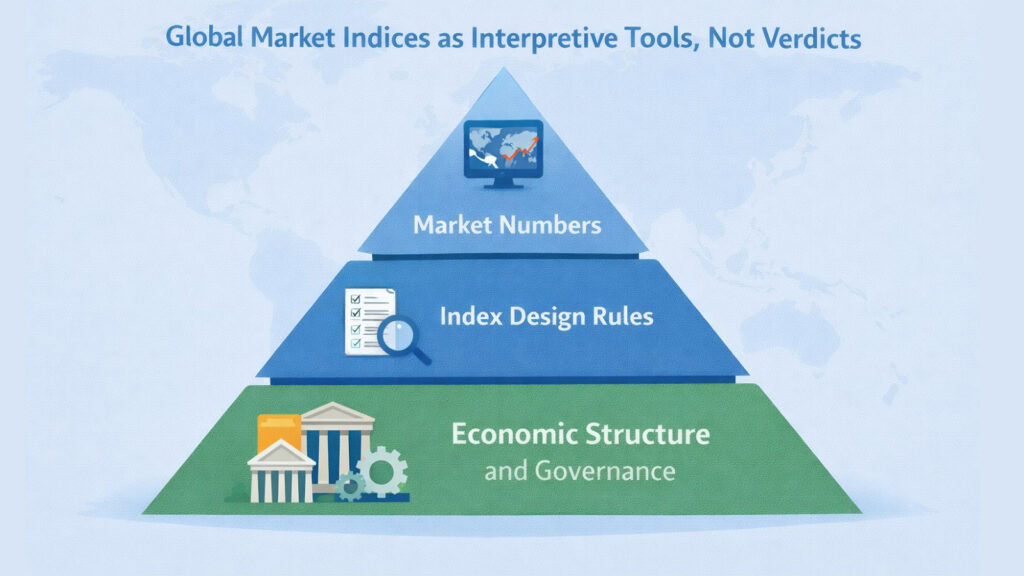
Global Market Indices organize chaos into order. They transform thousands of companies, millions of transactions, and constant price fluctuations into single numbers that move, trend, and can be compared. This organizational function provides immense value. Investors gain reference points. Economists obtain comparable data. Observers develop frameworks for understanding market behavior across regions and time periods.
Yet an organization requires choices. The six forces examined here show how those choices accumulate into coherent systems. Selection rules determine which companies gain visibility. Weighting methods assign influence. Rebalancing maintains relevance. Sector composition reflects economic structure. Governance ensures credibility. Limitations remind us what remains invisible.
These forces operate as invisible architecture. Most market participants interact with indices as finished products, watching their movements and interpreting their signals. The underlying structure fades from view, taken for granted like plumbing or electrical wiring. But structure determines meaning. An index weighted toward technology tells different stories than one balanced equally across sectors. An index excluding smaller companies reveals different truths than one embracing breadth.
Understanding this architecture deepens interpretation. When an index rises, asking which constituents drove the gain and how they are weighted reveals more than the headline number. When indices across regions diverge, examining their sector compositions and selection criteria explains why different markets move differently. The structure becomes a lens clarifying what indices actually measure versus what observers assume they measure.
Global Market Indices serve as interpretive tools, not judgment mechanisms. They do not declare which markets are superior or which economies are failing. They organize complexity so observers can develop their own understandings. A rising index does not necessarily mean widespread prosperity. A falling index does not confirm economic collapse. Context, composition, and construction all matter.
The evergreen reality is this: indices simplify but cannot replace direct examination. They provide starting points for inquiry, not ending points for understanding. Anyone seeking to comprehend markets must look beyond the numbers to the systems producing them, beyond the movements to the structures determining what moves. This article has explored those structures across regions and approaches. The knowledge strengthens interpretation without pretending to predict outcomes or prescribe actions.
Table 8: Global Market Indices Analytical Framework Summary
| Analytical Dimension | What It Reveals About Indices |
|---|---|
| Selection Rules | Determine which parts of an economy gain representation and which remain invisible in index composition |
| Weighting Systems | Shape which companies drive index movements and how market concentration versus diversity is balanced |
| Rebalancing Processes | Maintain relevance over time while managing tension between stability and responsiveness to change |
| Sector Representation | Reflect underlying economic structures and reveal regional comparative advantages or development patterns |
| Governance Frameworks | Ensure credibility through transparency, consistency, and independence from commercial pressures |
| Inherent Limitations | Highlight trade-offs between simplification and completeness; remind observers what indices cannot capture |
Markets will continue generating complexity. Economies will keep evolving. Global Market Indices will adapt, maintaining their role as organizing frameworks. Understanding how they work, what they include, and what they exclude transforms them from mysterious black boxes into comprehensible tools. That understanding matters for anyone seeking to make sense of global markets without relying on simplified narratives or taking index movements at face value.
Read More Business and Economy Articles
- 6 Powerful Ways Product Positioning Shapes Brand Identity
- Aspiring Entrepreneur: 6 Powerful Ways to Build Real Success
- Share Market Basics: 8 Powerful Components Explained
- Global South Economies: 6 Powerful Forces Driving World Growth
- AI Job Growth: 6 Powerful Trends Fueling a Brighter Future
- AI Job Losses: 6 Devastating Impacts You Can’t Ignore
- Sovereign Debt: 6 Alarming Risks Wealthy Nations Ignore
- Marketing Mastery: 6 Proven Ways to Drive Success
- Business 360° Breakthrough: Unlock Powerful Growth Today
- 6 Bold Human Resources Strategies To Boost Engagement