Table of Contents
Introduction: Global South Economies and the Silent Reordering of World Growth
The world’s economic gravity is shifting in ways that rarely make headlines. Growth no longer emerges from a single center or a few familiar capitals. It spreads across continents once labeled peripheral. Global South Economies now shape outcomes rather than await them. These nations influence trade routes, capital flows, and technological diffusion with quiet authority. Their impact on energy markets and financial systems grows more substantial each year.
The transformation runs deeper than growth statistics suggest. Global South Economies have woven themselves into the architecture of world commerce. They anchor supply chains that feed industries across continents. They control resources that power transitions to cleaner energy. They create digital infrastructure that serves billions. Their financial markets absorb and redirect capital in ways that matter to investors everywhere. This influence operates through scale, positioning, and participation rather than through dominance.
Understanding this shift requires looking past outdated frameworks. The world economy no longer divides neatly into those who lead and those who follow. Global South Economies contribute roughly 42 percent of global GDP now, up from just 26 percent in 2006, according to analysis from Chinese financial institutions. They account for approximately 80 percent of world economic growth. Their populations represent nearly 80 percent of humanity. These economies hold 60 percent of FDI flows and handle between 40 and 50 percent of international trade volume.
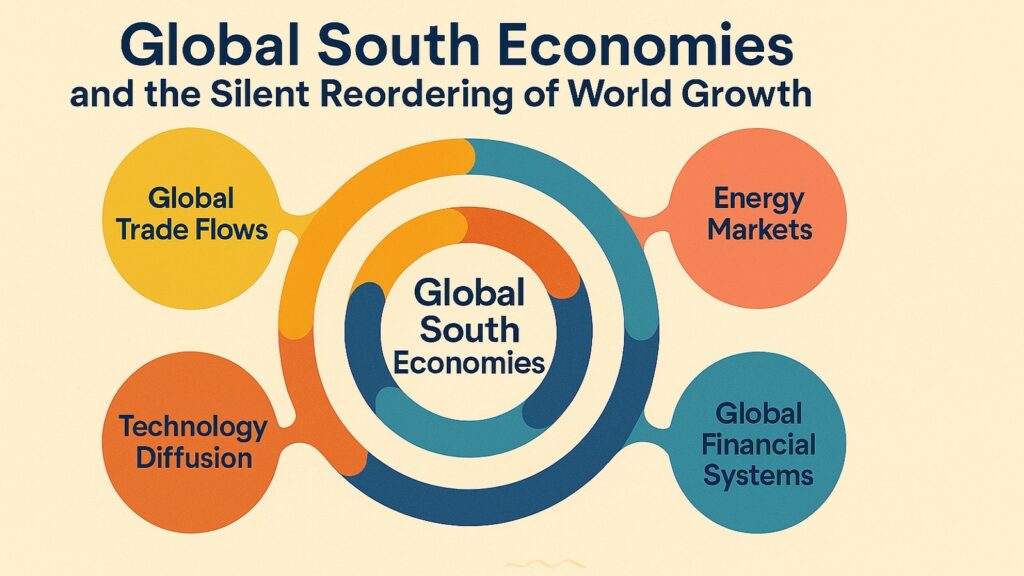
Six forces drive this structural change. Each force operates independently yet connects to the others. Together, they explain why Global South Economies matter more to world growth than conventional analysis suggests. The first force involves economic momentum rooted in domestic demand and population scale. The second concerns expanding roles in global trade networks. The third relates to their position as pillars of production systems. The fourth addresses rising influence in financial systems. The fifth centers on their strategic control of energy and natural resources. The sixth examines their emergence as sites of technology adaptation and AI-driven innovation.
These forces do not represent temporary advantages or cyclical trends. They reflect structural positions in the global economy. The following sections examine each force in detail. They use real data and concrete examples rather than speculation. They show how Global South Economies have become essential to understanding where world growth originates and how it flows.
Table: Global South Economies and Their Structural Integration
| Dimension | Connection to Global Economy |
|---|---|
| Global Trade | South-South trade reached $5.7 trillion in 2023 and represents 24% of global merchandise trade, having grown from 15% in 2005 |
| Labor Migration | Global South hosts nearly 80% of world population with major demographic dividends and workforce expansion |
| Global Tech Innovation | Accounts for less than 10% of global AI patents outside China but drives adaptive technology and digital solutions at scale |
| Global Financial Systems | Influences development finance, cross-border capital flows, and holds growing weight in international institutions |
| Natural Resources and Energy | Sub-Saharan Africa holds 30% of critical mineral reserves; Democratic Republic of Congo produces over 70% of global cobalt |
| Governance and Institutions | BRICS expanded membership represents collective GDP that surpassed G7 around 2020 in purchasing power parity terms |
| Global Supply Chain | Southeast Asia received $916 billion in FDI in 2022; Indonesia and Vietnam lead manufacturing diversification |
| Geopolitics | Economic clout ensures participation in governance; nearly 90% of surveyed respondents in 12 developing countries recognize Global South’s growing influence |
| Demographics | Population growth concentrated in Africa at 2.3% annually; working-age population expansion creates massive consumer markets |
| Climate and Sustainability | Energy transition mineral revenues projected at $16 trillion over 25 years; region positioned at center of green transition |
1. Global South Economies as the New Center of Global Economic Momentum
Economic momentum has relocated. The engines of growth that once concentrated in industrial capitals now distribute across economies that combine demographic scale with expanding domestic markets. Global South Economies drive this momentum through population growth, urbanization, and rising consumption patterns. They no longer depend solely on external demand. Internal markets absorb increasing shares of production. This shift changes how investors think about long-term growth.
The numbers tell a clear story. The Global South contributed 80 percent of world economic growth, according to representatives at forums discussing international financial systems. Their GDP growth rates consistently exceed those of developed economies. Where advanced economies grow at around 1.9 percent annually, Global South Economies average 4.2 percent through 2029, according to Boston Consulting Group analysis. This gap compounds over time. It means that within a generation, the balance of economic output shifts fundamentally.
Population scale matters, but it operates through specific mechanisms. Young demographics create expanding labor forces and consumer bases. Urbanization concentrates economic activity and enables infrastructure investment. Rising incomes unlock demand for goods and services that drive industrial development. ASEAN alone posted a combined GDP of $3.8 trillion in 2024 and projects to become the world’s fourth-largest economy by 2030. The bloc achieved 4.7 percent compound annual growth through strategic policies and regional cooperation.
Domestic demand now shapes investment strategies. Companies redesign product lines for markets in India, Indonesia, Nigeria, and Brazil. They locate production facilities near growing consumer bases. Financial institutions allocate capital based on where consumption expands rather than where it has been concentrated historically. This reorientation of investment flows reflects a fundamental shift in how businesses evaluate opportunities. Global expansion increasingly means participation in Global South Economies rather than exports from traditional centers.
Regional market depth amplifies this momentum. Trade within regions grows faster than global averages. Companies establish regional value chains that serve local markets. ASEAN members trade extensively with each other while also serving as export platforms. The India-China relationship demonstrates how even geopolitical tensions bend to economic logic when trade volumes reach a sufficient scale. Cross-border commerce through previously contested passages resumed in 2024 as both nations recognized economic interdependence.
The momentum creates feedback loops. Growth attracts investment, which funds infrastructure, which, in turn, enables more growth. Labor forces absorb modern skills, boosting productivity, raising incomes, and expanding markets. Banks develop lending capacity, which supports entrepreneurs, creates employment, and strengthens banking systems. These cycles operate across Global South Economies simultaneously. They reinforce each other through trade connections and capital flows. The result is sustained momentum that does not depend on conditions in advanced economies.
Table: Economic Momentum Indicators in Global South Economies
| Indicator | Impact on Global Growth |
|---|---|
| GDP Contribution | Global South share rose from 26% in 2006 to 42% in 2024, reflecting rapid economic expansion |
| Growth Differential | Average annual growth of 4.2% through 2029 compared to 1.9% for advanced economies creates compounding advantage |
| Population Scale | Nearly 80% of world population resides in Global South, providing massive consumer base and labor force |
| ASEAN Economic Weight | Combined 2024 GDP of $3.8 trillion positions bloc as world’s fifth-largest economy, targeting fourth by 2030 |
| Consumption Growth | Domestic consumption growing nearly as fast as GDP, creating dynamic markets for both domestic and foreign companies |
| Investment Reorientation | Global investors increasingly prioritize Global South markets in long-term growth planning and capital allocation strategies |
2. Global South Economies and Their Expanding Role in Global Trade Networks
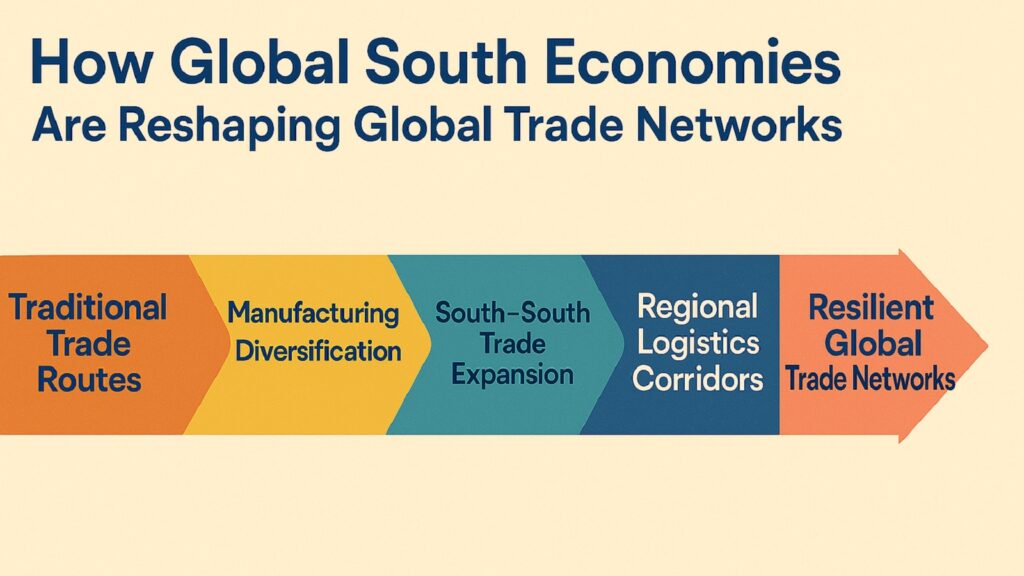
Trade patterns reflect power. The routes that goods travel, the agreements that govern commerce, and the infrastructure that enables exchange all reveal where economic authority resides. Global South Economies have reshaped these patterns through manufacturing diversification, expanding South-South trade, and developing new logistics corridors. They no longer serve simply as suppliers to advanced economies. They trade extensively with each other while maintaining connections to traditional partners.
South-South trade reached $5.7 trillion in 2023, according to UN Trade and Development statistics. This represents 24 percent of global merchandise trade, up from just 15 percent in 2005. The volume now exceeds North-North trade by some measures. This shift occurred gradually, but its implications run deep. When developing economies trade primarily with each other, they reduce dependence on single markets. They create regional supply chains that prove more resilient to disruptions. They negotiate terms that reflect mutual interests rather than historical power imbalances.
Manufacturing diversification drives this expansion. Vietnam’s exports grew from $320 billion in 2019 to $440 billion in 2023, achieving an 8.2 percent compound annual growth rate according to McKinsey analysis. Indonesia received $33 billion in greenfield manufacturing FDI in 2023, while its exports reached $290 billion. Companies relocate production to multiple sites across Global South Economies rather than concentrating in a single country. This spreads both capabilities and risks.
New logistics corridors follow these production shifts. Ports expand to handle increased container volumes. Rail networks connect manufacturing centers to export facilities. Shipping routes adjust to serve South-South trade lanes. The Patimban Port in Central Java specifically targets auto exports, attracting automotive companies that want efficient access to regional markets. These infrastructure investments reduce transit times and costs. They make Global South Economies more competitive as manufacturing bases.
Trade agreements reflect this reordering. The Regional Comprehensive Economic Partnership connects Asian economies in frameworks that facilitate commerce. ASEAN upgrades its Trade in Goods Agreement while negotiating new deals with partners, including Canada. Mercosur’s agreement with the EU, after over 20 years of negotiation, opens major markets to South American exporters. The Comprehensive and Progressive Trans-Pacific Partnership includes Global South nations alongside developed economies on more balanced terms.
Supply chain resilience now depends on this geographic diversification. Companies that concentrated production in a single country learned hard lessons from pandemic disruptions and geopolitical tensions. The “China plus one” strategy reflects recognition that supply chain stability requires multiple sources. Southeast Asia benefits as companies establish backup facilities. Mexico gains from nearshoring to North American markets. India attracts investment as firms seek alternatives. This diversification makes global trade networks more robust while spreading industrial capacity across Global South Economies.
Table: Global Trade Network Evolution and Global South Economies
| Trade Dimension | Structural Change |
|---|---|
| South-South Trade Volume | Reached $5.7 trillion in 2023, representing 24% of global merchandise trade compared to 15% in 2005 |
| Vietnam Export Growth | Exports expanded from $320 billion to $440 billion between 2019-2023 at 8.2% CAGR, demonstrating manufacturing surge |
| Indonesia Manufacturing FDI | Received $33 billion in greenfield manufacturing investment in 2023, becoming major production destination |
| Trade Agreement Expansion | RCEP, ASEAN-Canada negotiations, and EU-Mercosur deal reflect shifting trade architecture and market access |
| Port Infrastructure Development | Specialized facilities like Patimban Port in Java create dedicated export channels for automotive and other industries |
| Supply Chain Diversification | “China plus one” strategies spread production across multiple Global South locations, enhancing resilience |
3. Global South Economies as Pillars of the Global Supply Chain and Production Systems
Modern production systems are distributed across continents. Components move between countries before final assembly. Raw materials flow from extraction sites through processing facilities to manufacturing plants. Global South Economies occupy critical positions throughout these networks. They provide raw materials, manufacture intermediate goods, assemble final products, and increasingly design production processes. Without their participation, global supply chains would collapse.
The scale of this involvement became visible during recent disruptions. When pandemic lockdowns froze production, shortages rippled globally. When geopolitical tensions raised concerns about concentration, companies scrambled to diversify. These events revealed how thoroughly Global South Economies had integrated into production systems. Southeast Asia alone handles substantial shares of electronics manufacturing, automotive components, and textile production. Africa supplies minerals essential to batteries and renewable energy systems. Latin America produces agricultural commodities and manufactures vehicles.
Production relocation accelerates this integration. Companies responded to supply chain vulnerabilities by establishing facilities across multiple Global South locations. Southeast Asia received approximately $916 billion in FDI in 2022, according to Roland Berger analysis, with 60 percent flowing to East Asia within the region. This investment builds manufacturing capacity that serves both regional and global markets. It transfers technology and develops local supplier ecosystems. It creates employment and raises skill levels.
Industrial policy shapes these production networks. Governments in Global South Economies use incentives to attract investment and develop specific sectors. They invest in infrastructure that supports manufacturing. They establish special economic zones with streamlined regulations. Indonesia promotes electric vehicle production through targeted policies. India offers incentives for semiconductor manufacturing. These policies channel investment toward priority sectors while building long-term industrial capabilities.
Regional cooperation amplifies production capacity. ASEAN members coordinate policies to create integrated manufacturing networks. The African Continental Free Trade Area aims to develop regional value chains by reducing trade barriers. Cross-border collaboration on battery production between the Democratic Republic of Congo and Zambia exemplifies how countries combine resources to move up value chains. These cooperative arrangements enable smaller economies to participate in production systems that require scale.
Global consumption patterns depend on these production systems. Goods sold in advanced economies increasingly contain components made across multiple Global South locations. Electronics assembled in Vietnam contain parts from China, Indonesia, and Thailand. Vehicles manufactured in Mexico use steel from Brazil and parts from various Asian suppliers. This geographic distribution of production means that disruption anywhere affects supply chains everywhere. It also means that economic growth in Global South Economies directly impacts global consumption possibilities.
Table: Global South Economies in Global Supply Chain Architecture
| Supply Chain Element | Role and Scale |
|---|---|
| Southeast Asia FDI | Received $916 billion in foreign investment in 2022, with 60% concentrated in East Asian portions of region |
| Manufacturing Diversification | Vietnam, Indonesia, Thailand, Malaysia, and Philippines expand production across electronics, automotive, and textiles |
| Raw Material Supply | Africa provides 30% of critical mineral reserves; DRC produces over 70% of global cobalt for battery production |
| Production Network Integration | 88% of Southeast Asian trade flows remain within Asia-Pacific region, creating dense manufacturing networks |
| Industrial Policy Coordination | Special economic zones, targeted incentives, and infrastructure investment attract and channel manufacturing FDI |
| Regional Value Chain Development | African Continental Free Trade Area, DRC-Zambia battery collaboration, and ASEAN integration build connected production systems |
4. Global South Economies and Their Rising Influence in Global Financial Systems
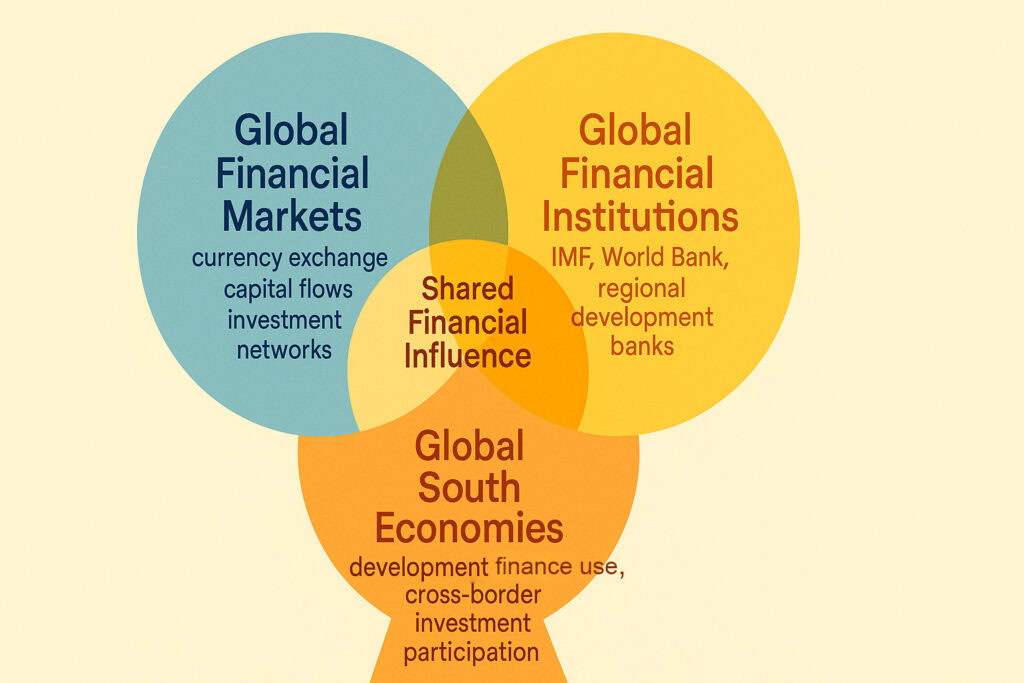
Financial systems channel capital across borders and through time. They set prices for currencies, allocate credit, and establish terms for development financing. Global South Economies increasingly shape these functions through their scale of participation rather than through institutional dominance. Their influence operates through market weight, cross-border capital flows, and growing voices in financial governance debates. This influence matters because it affects how resources flow and what terms govern international finance.
Cross-border investment patterns reflect this influence. Foreign direct investment to Global South Economies reached $916 billion in 2022, with the least developed countries posting 17 percent growth to $31 billion according to UN Trade and Development data. Capital flows to these markets seeking returns that growth provides. Portfolio investors allocate funds to bonds and equities in emerging markets. Development finance institutions channel resources through local banking systems. These flows create financial linkages that connect Global South Economies to global capital markets.
Currency markets register their growing weight. Large economies in the Global South influence exchange rate movements through their trade volumes and reserve accumulation. Central banks manage monetary policy in ways that affect capital flows and currency valuations globally. Digital payment systems developed in countries like India demonstrate how innovation can reshape how money moves across borders. The Unified Payments Interface processes transactions at a massive scale with minimal cost, offering models that other countries study.
Development finance evolves as Global South Economies gain voice. New institutions like the Asian Infrastructure Investment Bank provide alternatives to traditional development lenders. The New Development Bank, established by BRICS members, channels resources to infrastructure and sustainable development. South-South cooperation on financing expands through bilateral agreements and regional frameworks. These alternatives do not replace existing institutions, but they create options and shift leverage in negotiations over terms and conditions.
Debt systems involve Global South Economies as both borrowers and increasingly as lenders. China’s lending to developing countries through the Belt and Road Initiative and other channels has made it a major creditor. Other Global South nations provide financing to neighbors and partners. This creates more complex debt relationships than historical patterns where lending flowed primarily from developed to developing countries. It also creates new dynamics in debt restructuring and crisis management.
Financial governance debates now include voices from Global South Economies that demand representation proportional to economic weight. Despite accounting for over 40 percent of the global economy, these nations face disparity between economic contribution and influence in international financial institutions, according to statements from senior financial officials. Calls for reform emphasize the need for more equitable voting structures and greater participation in standard-setting processes. Progress comes slowly, but direction points toward financial systems that reflect current economic realities rather than historical arrangements.
Financial System Integration of Global South Economies
| Financial Dimension | Evidence of Influence |
|---|---|
| Foreign Direct Investment | FDI to Global South reached $916 billion in 2022; least developed countries saw 17% growth to $31 billion |
| Development Finance Institutions | Asian Infrastructure Investment Bank and New Development Bank provide alternative financing channels for infrastructure and development |
| Digital Payment Innovation | India’s Unified Payments Interface demonstrates how Global South economies pioneer financial technology at scale |
| South-South Capital Flows | China’s Belt and Road lending and other bilateral arrangements create new patterns of development finance |
| Governance Representation | Despite 40%+ share of global GDP, Global South seeks greater voice in IMF, World Bank, and standard-setting institutions |
| Currency Market Impact | Large emerging markets influence exchange rates, capital flows, and monetary conditions through trade volumes and reserve management |
5. Global South Economies as Strategic Anchors of Energy and Natural Resources
Energy security and resource availability shape national power and industrial capacity. Global South Economies hold dominant positions in both energy production and critical mineral reserves. They produce oil and gas that powers industries globally while controlling minerals essential for renewable energy systems and electronics. This positioning makes them central to both current energy systems and future transitions.
Critical mineral reserves concentrate in the Global South regions. Sub-Saharan Africa holds approximately 30 percent of proven critical mineral reserves, according to International Monetary Fund analysis. The Democratic Republic of Congo produces over 70 percent of global cobalt output and holds roughly half of proven reserves. South Africa, Gabon, and Ghana collectively account for more than 60 percent of global manganese production. These concentrations give host countries significant influence over supply chains for batteries and renewable energy technologies.
Energy production spans fossil fuels and renewables. Major producers in the Middle East, Africa, and Latin America supply global markets while simultaneously developing renewable capacity at scale. Solar installations in India, wind farms across Latin America, and geothermal projects in East Africa demonstrate how countries build clean energy systems while controlling hydrocarbon supplies. This dual position allows them to benefit from current systems while positioning for future transitions.
Revenue projections reach staggering levels. Global extraction revenues from copper, nickel, cobalt, and lithium could total $16 trillion over 25 years, according to IMF estimates. Sub-Saharan Africa stands to capture over 10 percent, potentially increasing regional GDP by 12 percent or more by 2050. Yet value addition potential remains largely unrealized. Raw bauxite sells for approximately $65 per ton while processed aluminum commands $2,335 per ton. The DRC increased cobalt value from $5.80 per kilogram at extraction to $16.20 after processing, demonstrating the benefits of local refinement.
Industrial demand links resource control to geopolitical balance. Countries dependent on imports face supply risks and price volatility. Those controlling resources gain negotiating leverage and revenue streams. Energy transitions amplify this dynamic as demand shifts from hydrocarbons to critical minerals. Global South Economies positioned to supply both current and future energy systems hold strategic advantages that influence infrastructure investment, technology partnerships, and diplomatic relationships across the international system.
Energy and Resource Positioning of Global South Economies
| Resource Category | Strategic Position |
|---|---|
| Critical Mineral Reserves | Sub-Saharan Africa holds 30% of proven reserves; DRC produces 70%+ of global cobalt with 50% of reserves |
| Revenue Projections | Extraction of copper, nickel, cobalt, and lithium projected to generate $16 trillion over 25 years globally |
| Regional Capture Potential | Sub-Saharan Africa positioned to reap 10%+ of cumulated mineral revenues, potentially raising GDP by 12% by 2050 |
| Value Addition Gap | Raw bauxite at $65/ton versus processed aluminum at $2,335/ton demonstrates unrealized processing opportunities |
| Local Processing Success | DRC increased cobalt value from $5.80/kg at extraction to $16.20/kg through local processing and refining |
| Energy Transition Control | Lithium, cobalt, nickel, and rare earth elements essential for EV batteries and clean energy concentrated in Global South |
6. Global South Economies and the Rise of New Technology and AI-Driven Innovation
Technology diffusion patterns determine who captures productivity gains and who falls behind. Global South Economies approach artificial intelligence differently from developed nations. They focus on adaptive technology rather than frontier research, emphasizing practical applications over theoretical advances. They leverage scale for experimentation and develop cost-efficient adoption strategies. This approach creates technology ecosystems suited to local conditions while contributing to global innovation.
Digital infrastructure expansion enables technology adoption. Internet penetration reaches 77 percent in Indonesia, opening opportunities for e-commerce and digital services. Mobile phone usage spreads across Africa despite infrastructure gaps. Digital payment systems process billions of transactions at minimal cost. These foundations allow deployment of AI-enabled solutions for agriculture, healthcare, education, and logistics that address specific challenges while building technical capacity.
Practical innovation emerges from constraints. Limited resources force efficient design while large populations enable testing at scale. Kenya and Nigeria have become hubs for AI applications in agriculture, healthcare, and education, according to analysis from strategic research organizations. Entrepreneurs use public-private partnerships and open-source models to build systems that work in resource-constrained environments. India’s digital identification system and payment interface demonstrate how solutions developed for local markets create templates others adopt globally.
Challenges remain substantial. Only about 35 percent of people in developing countries access the internet, according to World Bank data, compared to 80 percent in developed economies. Sub-Saharan Africa faces particularly acute gaps, with just 36 percent internet access and 80 percent electricity access. Energy demands of AI systems strain weak power grids. Data center infrastructure is concentrated in advanced economies, with the United States holding 40 percent of global capacity, while nearly half of African nations lack domestic facilities.
Despite obstacles, Global South Economies increasingly contribute to technology diffusion and adaptation. They develop solutions suited to tropical climates and limited resources. They pioneer approaches to digital identity and mobile payments. This contribution does not match frontier AI research, but it matters for how technology spreads globally and how productivity gains are distributed across countries. As AI becomes embedded in economic processes, participation in its development and deployment shapes competitive positions for decades.
Technology Innovation Dynamics in Global South Economies
| Innovation Dimension | Characteristics and Scale |
|---|---|
| Digital Infrastructure Growth | Internet penetration reaches 77% in Indonesia; mobile payments process billions of transactions at minimal cost |
| Practical Application Focus | Kenya and Nigeria emerge as AI hubs for agriculture, healthcare, and education using open-source models |
| Scale Advantages | Large populations in India, Indonesia, Nigeria enable testing AI solutions across hundreds of millions of users |
| Cost-Efficient Models | Open-source alternatives, shared compute resources, and targeted government investment reduce deployment barriers |
| Infrastructure Gaps | Only 35% internet access in developing countries versus 80% in developed; Sub-Saharan Africa at 36% internet, 80% electricity |
| Innovation Hub Emergence | India’s Aadhaar system and UPI demonstrate how local solutions create templates for global digital infrastructure |
Conclusion: Global South Economies and the Long-Term Shape of World Growth
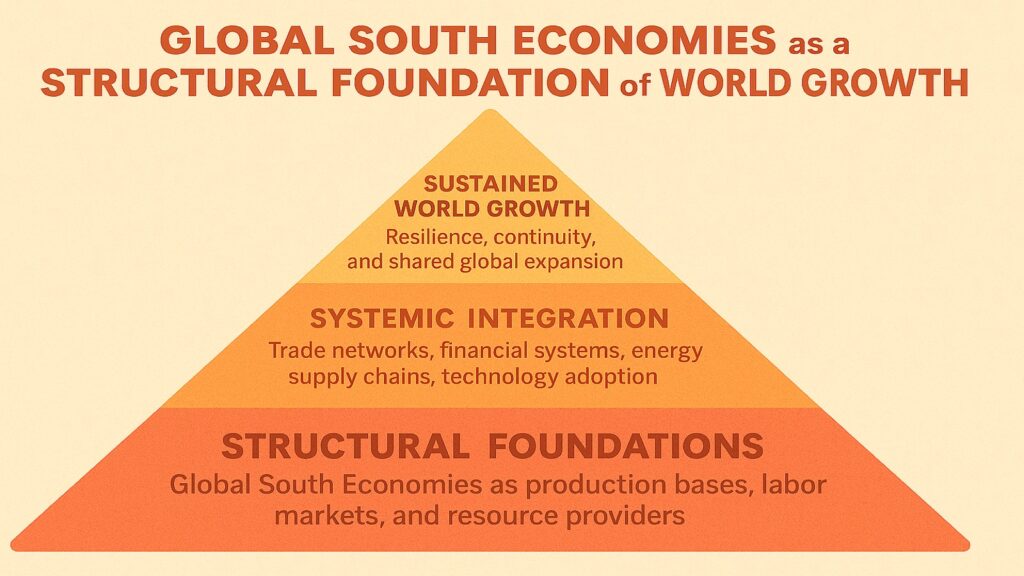
Six forces converge to make the Global South Economies the structural foundations of the global system. Economic momentum concentrates in regions with young populations and expanding markets. Trade networks reorganize around South-South commerce and diversified production. Supply chains depend on manufacturing capacity distributed across these economies. Financial systems channel capital through their institutions. Energy security and critical minerals flow from resources they control. Technology adaptation happens at scales that matter globally.
These forces reinforce each other through feedback loops. Manufacturing attracts investment, which funds infrastructure and enables more manufacturing. Resource revenues support industrial development, which diversifies economies. Digital systems facilitate trade, generating data that trains AI, which, in turn, improves those systems. Each force amplifies the others.
The integration runs deep. Global consumption depends on production in Global South Economies. Energy transitions require the minerals they supply. Supply chain resilience relies on its manufacturing capacity. Technology diffusion happens through their markets. Financial flows pass through their institutions. No major economic trend proceeds without their participation.
This structural position will not reverse. Demographics ensure continued population growth. Infrastructure investment creates lasting capacity. Industrial development builds capabilities that compound over time. Resource endowments remain fixed by geology. Market sizes expand with rising incomes. These fundamentals point toward sustained influence rather than temporary advantage.
Understanding this shift matters for everyone making decisions about the future. Policymakers who ignore Global South Economies miss where growth originates. Businesses that overlook these markets misallocate capital. Investors who focus only on traditional centers underweight regions, driving returns. The reordering operates quietly through millions of transactions and production decisions. The pace seems gradual, but the direction runs clear. Global South Economies have moved from the periphery to the center. They shape outcomes rather than react to them. Recognizing this matters for making sense of a world economy that redistributes power and influence across geographies in ways that reshape everything.
Table: Long-Term Structural Integration of Global South Economies
| Structural Element | Future Trajectory and Implications |
|---|---|
| GDP Share Trajectory | Continued expansion from current 42% as growth rates sustain 2-3x advantage over developed economies |
| Demographic Foundations | Young populations and urbanization ensure expanding labor forces and consumer markets for decades |
| Trade Network Density | South-South commerce projected to grow 3.8% annually through 2033, faster than North-North trade at 2.2% |
| Manufacturing Capacity | Industrial capabilities and supplier ecosystems compound as investment flows continue toward diversified locations |
| Resource Control Persistence | Geological endowments of critical minerals and energy resources remain concentrated, ensuring sustained leverage |
| Technology Ecosystem Development | Scale-based experimentation and adaptive innovation build technical capabilities that shape global diffusion patterns |