Table of Contents
Introduction: Data Analytics as the Foundation of Business Insights
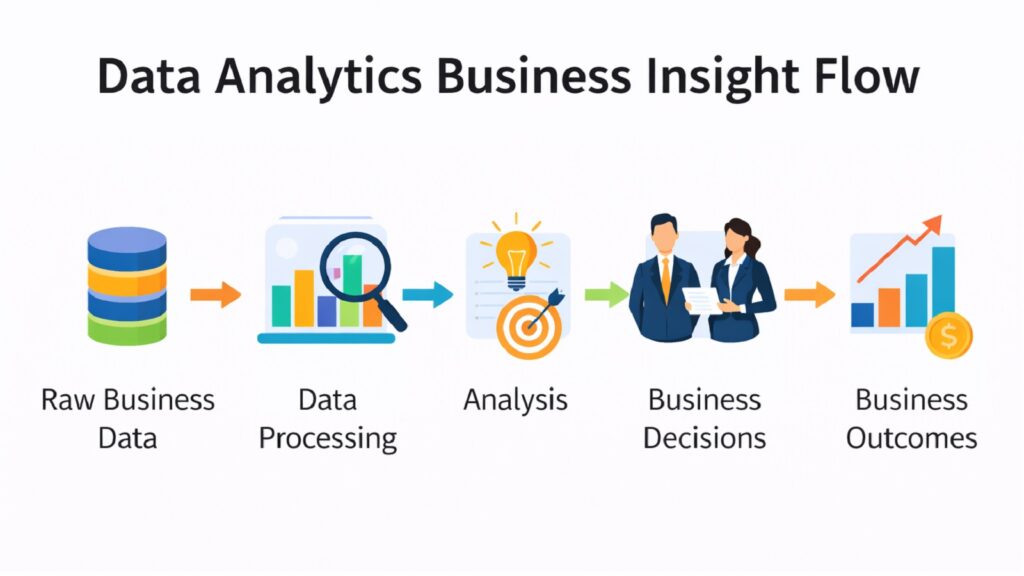
Every business generates data. Sales figures, customer clicks, service complaints, inventory movements — the list goes on. But raw data by itself means very little. It sits there, inert, until someone decides to make sense of it. That is exactly where data analytics comes in. At its core, data analytics is the process of examining raw data to draw conclusions that help a business move forward. It is the bridge between information and insight.
Without data analytics, businesses are essentially flying blind. They may have a sense of how things are going, but that sense is built on instinct and assumption rather than evidence. In a competitive market, that gap can be costly. Data analytics changes the picture. It allows companies to understand their customers more deeply, identify where operations are slowing things down, and spot opportunities before competitors do. Data analytics is an important business essential without which modern businesses would loose their competitive edge.
The eight foundations covered in this article form a connected system. They are not separate activities you pick and choose from. They work together, each one feeding into the next. Data collection comes first, because without the right data, nothing else holds up. Cleaning that data follows, because messy data produces unreliable answers. Integration brings scattered sources together. Exploratory analysis opens the door to discovery. Descriptive analytics tells you what happened. Diagnostic analytics tells you why. Predictive analytics shows you what might happen next. And data visualization makes all of that understandable to the people who need to act on it.
Businesses that master these eight foundations do not just make better decisions. They build a culture where every choice is grounded in evidence. That is a quiet but powerful kind of competitive advantage. The rest of this article walks through each foundation in detail, with a focus on what matters most — practical business impact.
Data Analytics in Business: An Overview of the Eight Foundations
| Data Analytics Foundation | Core Business Purpose |
| Data Collection | Gathers relevant, timely data from business sources to support accurate analysis |
| Data Cleaning | Removes errors, duplicates, and inconsistencies to make data trustworthy |
| Data Integration | Combines data from multiple systems into a single, unified business view |
| Exploratory Analysis | Uncovers hidden patterns, trends, and unexpected relationships in data |
| Descriptive Analytics | Summarizes historical data to show what has already happened in the business |
| Diagnostic Analytics | Explains why certain outcomes occurred by identifying causes and relationships |
| Predictive Analytics | Uses historical patterns to forecast future trends and guide planning decisions |
| Data Visualization | Presents complex data in clear visual formats that support faster decisions |
1. Data Analytics and Data Collection: Building the Right Data Foundation
Data analytics is only as strong as the data it works with. This is not a technical observation — it is a business reality. If the data coming in is incomplete, irrelevant, or out of date, then every analysis built on it will carry those same weaknesses. The quality of your insights depends almost entirely on the quality of the data you collect in the first place.
What makes data collection right for a business context? Three things matter most. The data needs to be relevant to the question you are trying to answer. It needs to be timely, meaning it reflects current conditions rather than outdated ones. And it needs to be aligned with your business objectives, so that the information gathered actually connects to decisions that matter.
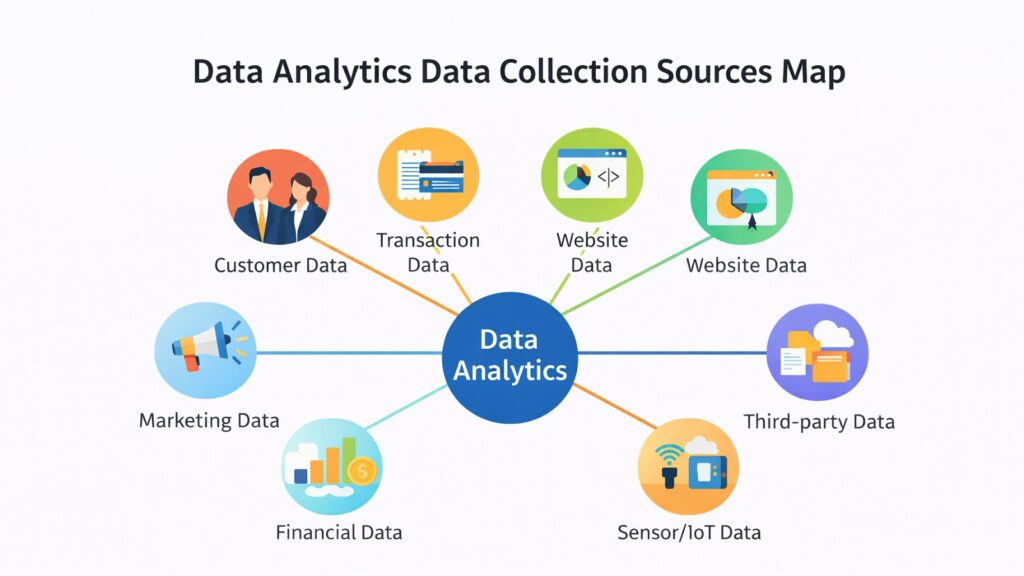
Businesses collect data from many different places. Customer interactions — both online and offline — produce behavioral data. Sales transactions capture purchasing patterns. Website behavior shows how users engage with digital content. Operational systems record supply chain movements, staffing levels, and production outputs. Each source tells part of the story, but no single source tells it all.
Poor data collection creates real risks. If you collect data that skews toward one customer segment and miss another, your insights will reflect that imbalance. If your data is weeks old when it should be real-time, decisions made on it may already be irrelevant. A retail business that only tracks in-store purchases, for instance, will miss the behavior of its online customers entirely. That gap does not just limit analysis — it shapes strategy in ways that can quietly damage the business over time.
Better data collection leads to better insight quality. A simple example makes this clear. A company that collects both purchase data and customer service interaction data together can see whether product complaints correlate with churn. Without both data streams, that pattern stays hidden. Data analytics depends on having the right ingredients. Collection is where those ingredients are gathered.
Data Analytics and Data Collection: Key Business Data Sources
| Data Sources For Data Analytics | Business Insight Generated |
| Customer purchase history | Reveals buying patterns and product preferences over time |
| Website and app behavior | Shows how users navigate, what they engage with, and where they drop off |
| Customer service records | Highlights recurring complaints and service gaps affecting satisfaction |
| Point-of-sale transactions | Tracks sales volume, peak periods, and product performance by location |
| Social media interactions | Captures brand sentiment and customer feedback in real time |
| Supply chain and inventory data | Monitors stock levels, supplier delays, and fulfillment efficiency |
| Employee productivity records | Identifies workflow bottlenecks and operational inefficiencies |
| Survey and feedback responses | Collects direct customer opinion to supplement behavioral data |
2. Data Analytics and Data Cleaning: Ensuring Data Quality and Reliability
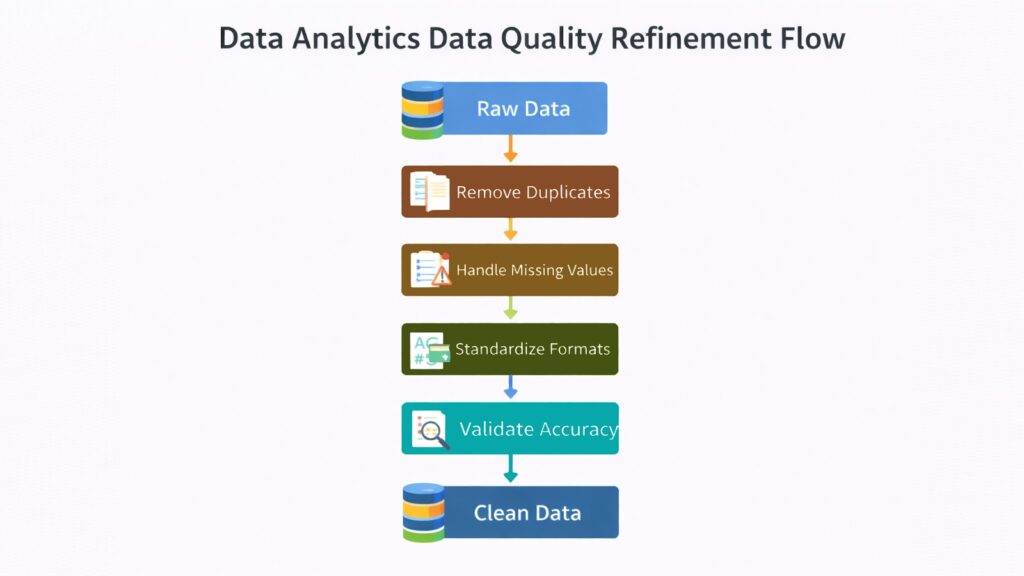
Raw data is rarely clean. Anyone who has worked with real business data knows this. Records come in from different systems with different formats. Fields are left blank. The same customer appears twice under slightly different names. Dates are entered inconsistently. Figures from one department do not match figures from another, even when they should refer to the same thing. This kind of messiness is not unusual — it is the norm.
The most common problems in business data include duplicate records, missing values, formatting inconsistencies, outdated entries, and conflicting data across systems. These problems do not stay neatly contained in the data. They travel into the analysis and corrupt the results. A forecast built on duplicate sales records will overstate revenue. A customer segmentation built on incomplete profiles will produce misleading groupings.
The business risks here are concrete. A marketing team working from incorrect customer records could send the wrong message to the wrong audience, wasting budget and damaging relationships. A finance team relying on inconsistent figures could produce a budget projection that looks solid but rests on faulty ground. These are not edge cases — they happen regularly in organizations that underinvest in data quality.
Data analytics relies on a systematic cleaning process to generate trustworthy insights. This cleaning process entails identifying issues and addressing them through a structured approach: eliminating duplicates, addressing or marking missing values, standardizing formats, and reconciling conflicting entries. Although it may not be glamorous work, it is essential. Without this foundational step, the analytical engine operates, but it does so on compromised fuel.
Consider a mid-sized retailer running a loyalty program. If customer records are not cleaned regularly, members may receive duplicate communications, points may be miscounted, and customer profiles may reflect stale preferences. The program’s effectiveness drops, and the business never quite knows why because the data feeding the analysis was never reliable to begin with. Clean data is the starting point for trustworthy analytics.
Data Analytics and Data Cleaning: Common Data Quality Issues and Business Impact
| Data Quality Issues in Data Analytics | Business Impact if Left Unresolved |
| Duplicate customer records | Leads to repeated outreach, inflated counts, and unreliable segmentation |
| Missing transaction values | Distorts revenue calculations and financial reporting accuracy |
| Inconsistent date formats | Causes errors in time-series analysis and trend identification |
| Outdated contact information | Results in failed communications and wasted marketing spend |
| Conflicting product codes | Creates inventory mismatches and fulfillment errors across systems |
| Blank fields in customer profiles | Limits personalization and reduces targeting effectiveness |
| Incorrect unit measurements | Leads to errors in demand planning and supply chain decisions |
| Merged records from system migrations | Produces false patterns that mislead analytical models |
3. Data Analytics and Data Integration: Unifying Business Data Systems
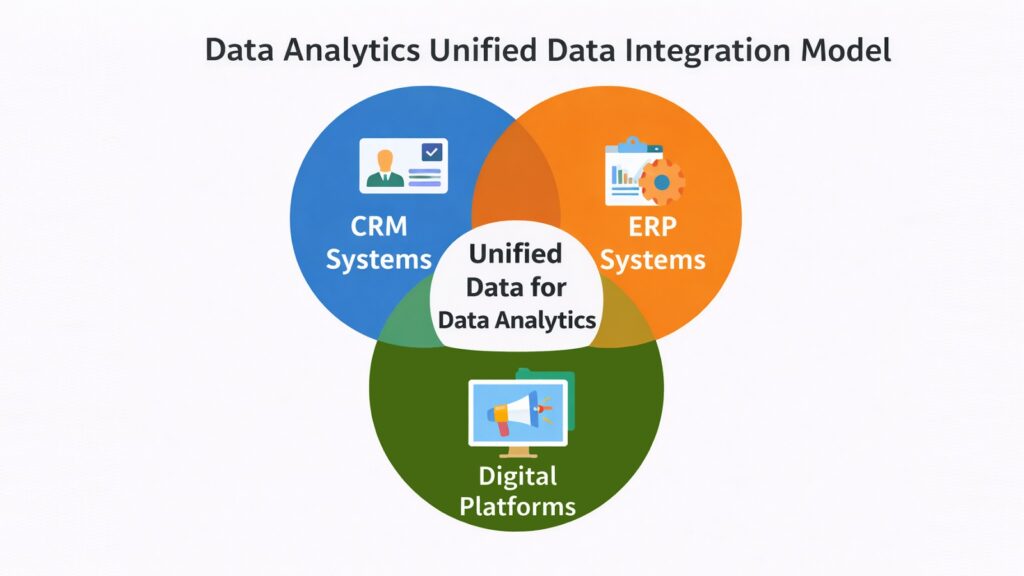
Most businesses do not run on a single system. They use a CRM to manage customer relationships, an ERP to handle operations, a separate platform for digital marketing, a point-of-sale system for in-store transactions, and often several more tools beyond those. Each system does its job well. But when data stays trapped inside each system, the business cannot see the full picture.
This is the problem of data silos. When your customer data lives in the CRM and your transaction data lives in the POS system and your marketing data lives in a separate platform, you lose the ability to connect the dots. You cannot easily see how a marketing campaign affected purchasing behavior, or how customer service interactions correlate with retention rates. The data exists, but its value is locked away.
Data integration solves this by bringing together data from multiple sources into a unified view. It is the process of merging data streams so that analysts and decision-makers can work from a single, consistent dataset rather than piecing together information from disconnected sources. In practice, this often involves connecting systems through data pipelines, warehouses, or integration platforms that pull and align information from across the business.
The business benefits of integration are immediate and significant. Consistency improves because the same data is used across departments. Completeness improves because no single source tells the whole story, but integrated data can. And decision clarity improves because leaders can look at a unified dataset rather than reconciling reports that contradict each other.
A useful example is a retail business that integrates its online and offline transaction data. In isolation, the online store analytics show one picture and the physical store data shows another. But when integrated, the business can see cross-channel behavior — customers who browse online and buy in-store, or vice versa. That pattern, invisible in isolated data, becomes a strategic insight that shapes inventory planning, marketing, and store layout decisions.
Data Analytics and Data Integration: Key Systems and Business Value
| Business System | Data Contributed to Integrated Analytics |
| CRM (Customer Relationship Management) | Customer profiles, interaction history, and relationship timelines |
| ERP (Enterprise Resource Planning) | Inventory, procurement, production, and financial transaction data |
| Digital marketing platform | Campaign performance, click-through rates, and audience engagement |
| Point-of-sale system | In-store transaction details, product sales, and cashier-level data |
| E-commerce platform | Online orders, cart abandonment rates, and digital customer behavior |
| HR and workforce system | Employee performance, attendance, and operational staffing data |
| Customer support platform | Ticket volume, resolution times, and recurring complaint categories |
| Logistics and supply chain system | Delivery timelines, supplier reliability, and fulfillment costs |
4. Data Analytics and Exploratory Analysis: Discovering Hidden Patterns
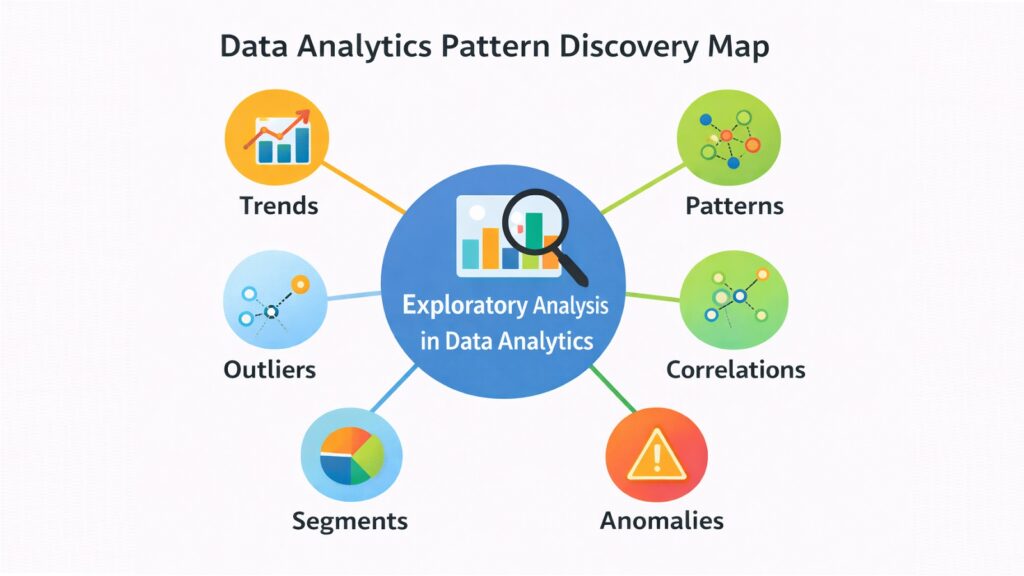
Most analytical work starts with a question. But some of the most valuable insights come not from answering a question you already had, but from discovering questions you did not know to ask. That is the spirit of exploratory analysis. It is the phase of data analytics where you look at the data without a fixed hypothesis and see what it tells you on its own terms.
Exploratory analysis is a process of open observation. You look at distributions, spot outliers, compare groups, and trace relationships between variables — not to confirm a preconceived idea, but to understand what the data actually contains. It is a mindset as much as a method. It asks: what is surprising here? What does not fit the expected pattern? Where is something happening that we have not noticed before?
For businesses, this step reveals things that structured reporting often misses. A sales team reviewing monthly reports might see consistent average performance across regions. But an exploratory look at the same data might reveal that one region spikes dramatically during a specific week each quarter — a pattern that was always there but never surfaced in aggregated summaries. That spike might correspond to a local event, a competitor’s seasonal absence, or a distribution quirk worth capitalizing on.
Anomalies and unexpected relationships are among the most useful discoveries in this phase. A company examining its customer base might find that a small segment of customers generates a disproportionate share of complaints — and also a disproportionate share of revenue. That tension is not visible without exploration. Once seen, it changes how the business thinks about retention and service investment.
Exploratory analysis rewards curiosity and patience. It is not about rushing to conclusions. It is about creating the conditions for genuine discovery, so that the deeper analytical work that follows is aimed at the right targets. IBM’s Institute for Business Value has noted that organizations that treat data exploration as a regular practice tend to identify new growth opportunities significantly faster than those that rely solely on predefined metrics.
Data Analytics and Exploratory Analysis: Discovery Dimensions and Business Relevance
| Exploration Focus of Data Analytics | Business Relevance |
| Sales spike anomalies | Reveals seasonal, regional, or event-driven patterns worth building on |
| Customer segmentation clusters | Uncovers distinct groups with different needs that were previously lumped together |
| Product correlation patterns | Shows which products are frequently bought together, informing bundling strategy |
| Churn precursors | Identifies behavioral signals that appear before customers stop engaging |
| Operational bottlenecks | Surfaces process delays that standard reporting averages away |
| Revenue concentration | Highlights that a small proportion of customers or products drives most value |
| Complaint category trends | Shows which issues are rising before they become widespread problems |
| Time-of-day demand variation | Reveals patterns in when customers engage, enabling better staffing or promotion timing |
5. Data Analytics and Descriptive Analytics: Understanding What Happened
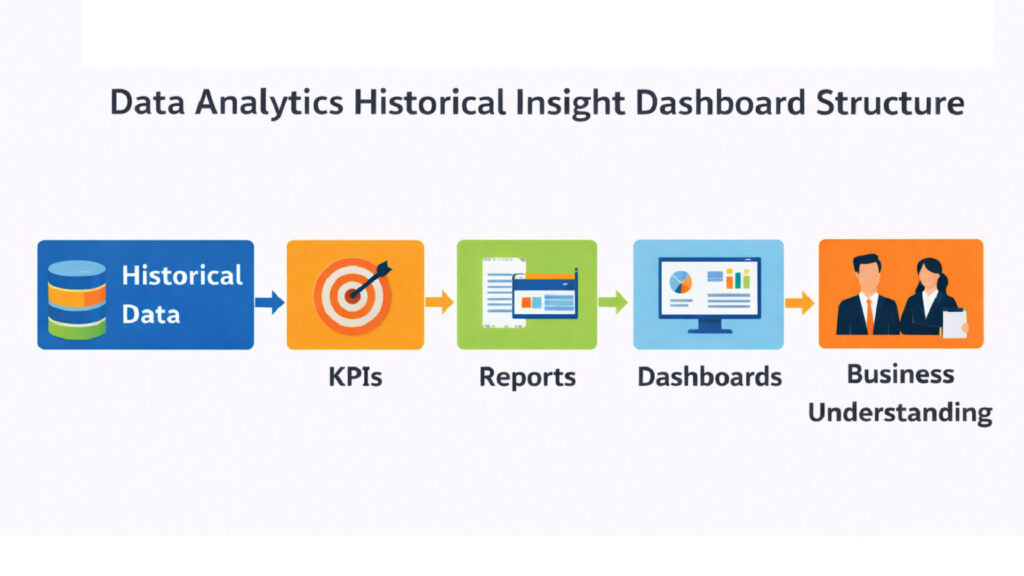
Before a business can understand why something happened or what might happen next, it needs a clear picture of what already happened. That is the purpose of descriptive analytics. It takes historical data and turns it into structured summaries that give businesses a reliable view of past performance. In many organizations, this is the most common form of data analytics in daily use.
Descriptive analytics works through metrics, reports, and dashboards. A monthly revenue report is descriptive analytics. A year-over-year comparison of customer counts is descriptive analytics. A dashboard showing daily website traffic is descriptive analytics. These outputs are familiar to most people in business, which is part of what makes them powerful — they communicate performance in ways that do not require technical expertise to understand.
The value of descriptive analytics lies in its clarity and consistency. When a business tracks the same metrics over time in the same way, it builds a reliable record that supports evaluation and accountability. Leadership can assess whether targets were met, where performance fell short, and how current results compare to historical benchmarks. Without this foundation, other forms of analytics lose much of their context.
Accuracy matters here more than almost anywhere else. A flawed descriptive report sends ripples through every decision downstream. If the revenue figure on the monthly summary is overstated due to double-counted transactions, the team reviewing it will draw conclusions that do not reflect reality. Establishing clean, consistent, well-defined metrics is not an administrative detail — it is a core business competency.
According to Gartner, descriptive analytics accounts for the majority of business intelligence activity in most organizations. Companies use it to track customer growth trends, monitor operational efficiency, review campaign performance, and assess product popularity. Each of those activities creates the informational bedrock that higher-level analytics then builds upon.
Data Analytics and Descriptive Analytics: Common Business Metrics and Their Uses
| Business Metric | What It Tells the Business |
| Monthly recurring revenue | Tracks the consistency of income and highlights growth or decline trends |
| Customer acquisition count | Measures how effectively marketing and sales efforts bring in new customers |
| Average order value | Shows spending behavior per transaction and informs pricing decisions |
| Website traffic by channel | Identifies which marketing sources drive the most visitor volume |
| Product return rate | Signals potential quality or expectation issues affecting customer satisfaction |
| Employee absenteeism rate | Highlights workforce stability and operational planning risk |
| Customer retention rate | Reflects loyalty and the long-term health of the customer base |
| Cost per unit produced | Measures operational efficiency and the impact of process changes on margins |
6. Data Analytics and Diagnostic Analytics: Understanding Why It Happened
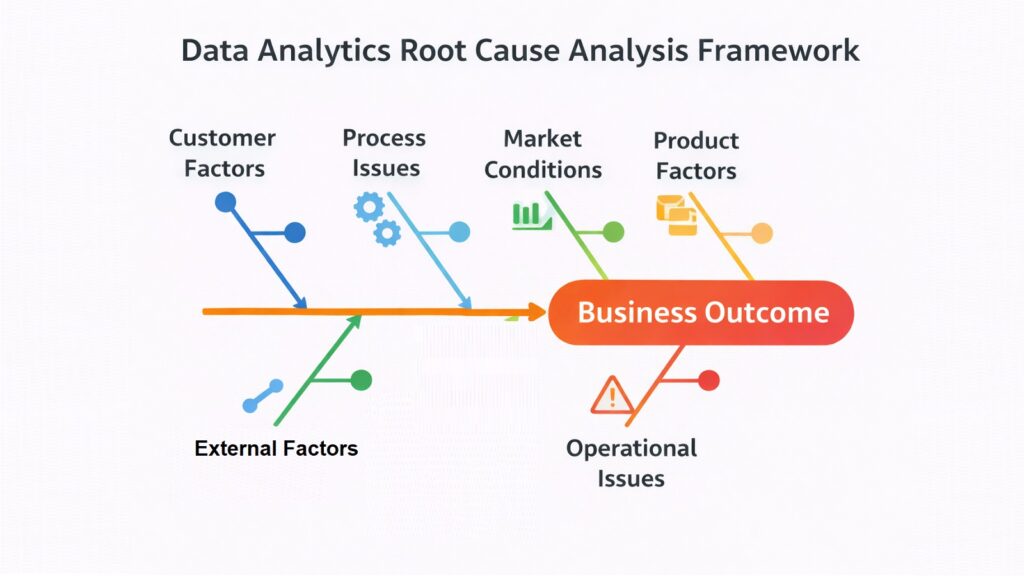
Knowing what happened is useful. Knowing why it happened is transformative. Diagnostic analytics is the layer of data analytics that moves beyond observation into explanation. It takes the patterns identified in descriptive reporting and asks the harder question: what caused this?
This is where data analytics begins to earn its reputation for driving real business change. A company might see from its descriptive reports that customer churn increased by 12 percent last quarter. That number is important. But without understanding why it happened, the response is guesswork. Diagnostic analytics provides the reasoning. It might reveal that churn spiked among customers who had contacted the support team more than twice within 60 days — a pattern that points directly to a service quality problem.
The methods used in diagnostic analytics include segmentation, comparison across groups, root cause tracing, and correlation analysis. These approaches do not require deep statistical expertise to be valuable. At their core, they involve comparing different slices of data to find where outcomes diverged and tracing that divergence back to a cause. Which customer segments churned at higher rates? Which products generated the most complaints? Which stores underperformed, and what did those stores have in common?
The business value of this step is clearest when decisions need justification. It is not enough to say that sales dropped — leadership needs to know whether that drop was caused by pricing changes, a competitor’s promotion, a supply disruption, or something else entirely. Each cause calls for a different response. Diagnostic analytics provides the evidence to act with specificity rather than assumption.
McKinsey has indicated that organizations employing diagnostic analytics for root cause analysis are able to resolve operational issues considerably more swiftly and with more precise interventions compared to those that depend solely on observation. The distinction lies not merely in efficiency — it represents the difference between addressing symptoms and tackling underlying causes.
Data Analytics and Diagnostic Analytics: Business Problems and Root Cause Focus
| Business Problem Observed | Diagnostic Analytics Approach |
| Sales declined in Q3 | Compare sales by region, product line, and channel to isolate the source of decline |
| Customer churn increased | Segment churned customers by behavior, tenure, and service interactions |
| Marketing campaign underperformed | Analyze audience targeting, message timing, and channel performance separately |
| Product return rate spiked | Correlate returns with batch dates, delivery times, and complaint categories |
| Employee turnover rose | Examine exit data by department, manager, and role level to find patterns |
| Operational costs exceeded budget | Break down cost categories and trace overruns to specific activities |
| Website conversion rate dropped | Compare funnel drop-off rates before and after design or pricing changes |
| Supplier delays increased | Cross-reference delay data with supplier, route, and season variables |
7. Data Analytics and Predictive Analytics: Anticipating Future Outcomes
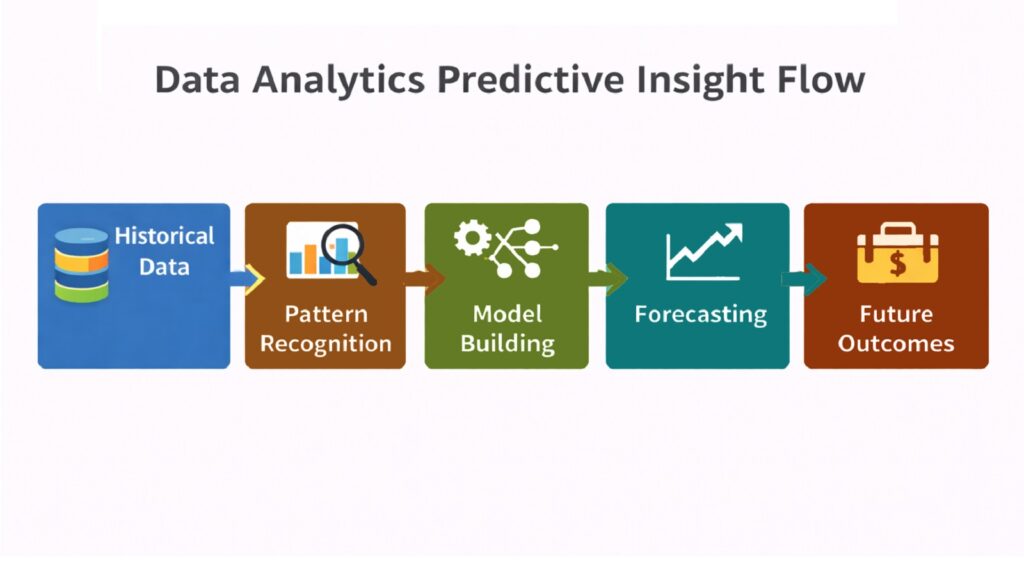
The most progressive aspect of data analytics is its capacity to predict future events. Predictive analytics leverages historical data — including patterns, behaviors, and trends from the past — to create forecasts regarding future occurrences. This approach transitions a business from a reactive stance, where responses are made to events that have already transpired, to a proactive stance, where preparations are made in advance of upcoming events.
For businesses, the practical applications of predictive analytics are wide-ranging. Demand forecasting is perhaps the most common. A retailer that can predict which products will sell well in the coming quarter can manage inventory more efficiently, reducing both overstock waste and stockout situations. A services company that can forecast customer demand can allocate staff more effectively and avoid the twin problems of overstaffing and understaffing.
Risk management is another strong use case. Banks and insurance companies have long used predictive models to assess the likelihood that a loan will default or a claim will be made. The same principle applies to businesses managing operational risk — a manufacturing company might use historical equipment data to predict when a machine is likely to fail, enabling scheduled maintenance before a breakdown disrupts production.
Customer behavior prediction is also a growing priority. If a model can identify which customers are showing early signs of disengagement — reduced purchase frequency, fewer app logins, declining email open rates — the business can intervene with targeted offers or outreach before those customers leave. According to Bain and Company, improving customer retention rates by five percent can increase profits by 25 to 95 percent, which makes early prediction of churn a high-value analytical priority.
Predictive analytics does not guarantee accuracy. Forecasts are probabilistic, not certain. But even imperfect predictions, when grounded in solid historical data, are far more useful than no prediction at all. They shift planning from gut feeling to informed estimation, and that shift alone represents a meaningful improvement in business decision quality.
Predictive Analytics: Business Applications and Planning Impact
| Business Application | How Predictive Analytics Improves Planning |
| Demand forecasting | Anticipates product demand to optimize inventory and reduce waste or shortage |
| Customer churn prediction | Identifies at-risk customers early so retention efforts can be deployed in time |
| Credit and risk assessment | Estimates default or claim likelihood to guide financial and lending decisions |
| Staff scheduling optimization | Forecasts peak demand periods to align workforce levels with actual need |
| Equipment failure prediction | Signals maintenance needs before breakdowns occur, reducing downtime costs |
| Pricing optimization | Forecasts price elasticity to set rates that maximize revenue without losing customers |
| Campaign response prediction | Estimates which customer segments are most likely to respond to a given offer |
| Supply chain disruption anticipation | Flags supplier or logistics risks based on historical delay and variability data |
8. Data Analytics and Data Visualization: Communicating Insights Clearly
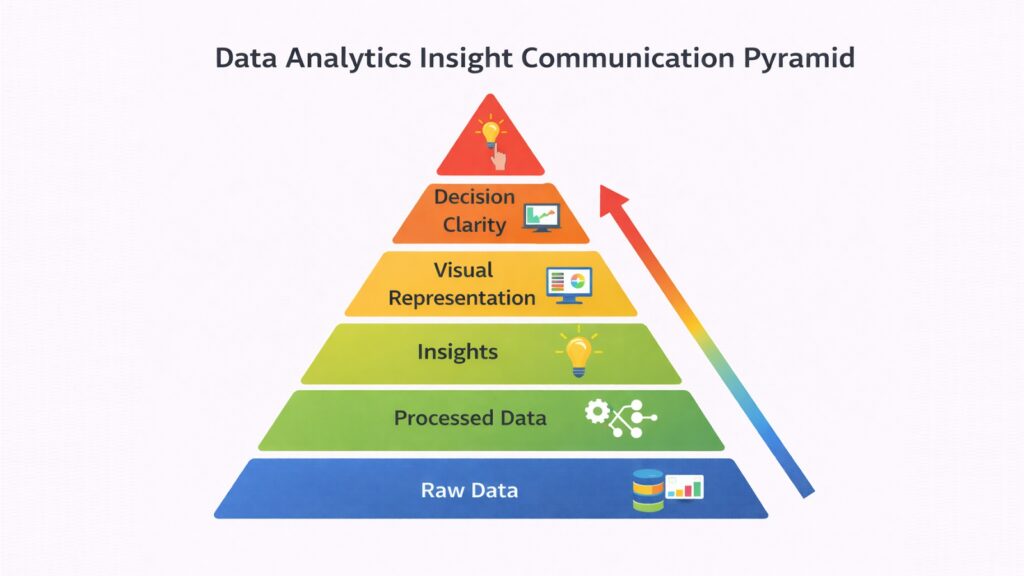
An insight that cannot be communicated is an insight that cannot be used. This is a simple truth that organizations sometimes underestimate. Teams can invest heavily in data collection, cleaning, integration, and sophisticated analysis — and still fail to create impact if the results cannot be understood by the people who need to act on them. Data visualization is what bridges that gap.
Data visualization is the practice of representing analytical findings in visual form. Charts, graphs, dashboards, heat maps, and timelines all fall under this category. The goal is not decoration — it is clarity. A well-designed visualization makes a complex set of numbers instantly interpretable. A poorly designed one creates confusion even when the underlying analysis is sound.
The importance of simplicity in visualization is often underestimated. A chart with too many data series, too many colors, or too much annotation forces the viewer to work harder than necessary to extract the point. Good visualization does the opposite. It leads the eye to what matters. A sales trend line that clearly shows the inflection point where growth slowed tells a story without requiring the viewer to dig through tables of numbers.
Storytelling plays a role here that most people do not associate with data. When visualizations are arranged in sequence — here is what happened, here is why, here is what we expect next — they create a narrative that decision-makers can follow and remember. A static table of figures rarely creates that effect. A well-constructed dashboard that flows from summary to detail, from what to why, is far more likely to drive action.
According to research by the Wharton School of Business, presentations that use visual data are 67 percent more persuasive than those that rely on text or numbers alone. In practice, this means that the best analytical work in the world is more likely to influence decisions when it is paired with clear, well-designed visuals that make the insight undeniable at a glance.
Data Analytics and Data Visualization: Visualization Types and Business Decision Support
| Visualization Type | Best Used For in Business Context |
| Line chart | Tracking trends over time, such as monthly revenue or customer growth |
| Bar chart | Comparing values across categories, such as sales by region or product type |
| Heat map | Identifying concentration and intensity patterns across two-dimensional variables |
| Scatter plot | Exploring relationships and correlations between two continuous business variables |
| Pie or donut chart | Showing proportional composition of a whole, such as revenue share by product |
| Funnel chart | Visualizing drop-off rates across sequential stages in a sales or customer journey |
| Dashboard with KPIs | Providing an at-a-glance summary of key performance metrics for leadership review |
| Waterfall chart | Explaining how a starting value changes step by step to reach a final outcome |
Conclusion: Data Analytics as a Unified System for Business Insights
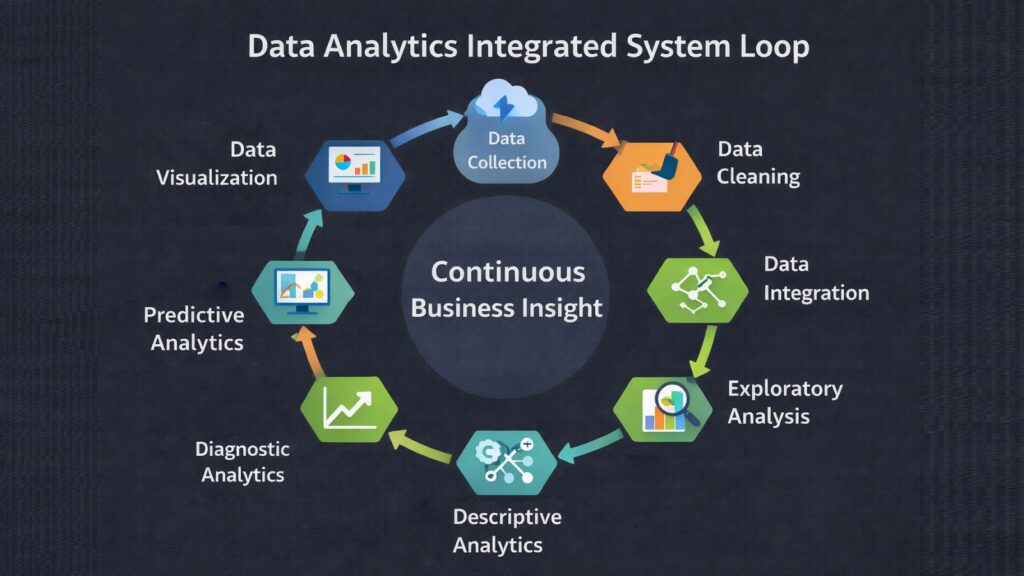
Data analytics is not one thing. It is a system — a connected sequence of disciplines that work together to transform raw information into something a business can actually use. Treating any single part of that system in isolation, while neglecting the others, undermines the whole. The eight data analytics foundations explored in this article are not independent steps you complete and then move on from. They are ongoing, interdependent activities that reinforce each other.
The system starts with collection. If the data gathered is irrelevant or incomplete, every downstream process inherits those flaws. Cleaning ensures the data is trustworthy before it enters analysis. Integration brings together the scattered pieces so that the full picture is visible. Exploratory analysis opens the door to discoveries that structured reporting would miss. Descriptive analytics builds the historical awareness that gives context to everything else. Diagnostic analytics provides the reasoning behind outcomes. Predictive analytics extends that reasoning forward in time. And visualization makes it all accessible to the people who need to act on it.
Each step builds on what came before. An organization that invests in good data collection but neglects cleaning will produce unreliable insights. One that cleans and integrates data but skips exploratory analysis may miss the patterns that matter most. One that does everything well analytically but presents results poorly will find that its insights go unused. The system only delivers its full value when all eight foundations are in place and working together.
The most important shift data analytics enables is a cultural one. When businesses commit to treating data as a continuous resource rather than a periodic report, they stop reacting to the past and start shaping the future. That ongoing capability — built on these eight foundations — is what drives the kind of sustained, insight-driven growth that is difficult to imitate and even harder to reverse.
Data Analytics as a Unified System: How Each Foundation Contributes to Business Growth
| Data Analytics Foundation | Contribution to Long-Term Business Growth |
| Data Collection | Ensures the business captures relevant, timely inputs that reflect real conditions |
| Data Cleaning | Builds trust in the data so that decisions rest on accurate, reliable information |
| Data Integration | Creates a unified view that supports coordinated, cross-functional decision-making |
| Exploratory Analysis | Surfaces growth opportunities and risks that routine reporting would never reveal |
| Descriptive Analytics | Provides the performance record needed to evaluate strategy and track progress |
| Diagnostic Analytics | Enables targeted interventions by identifying the true causes of business outcomes |
| Predictive Analytics | Supports forward-looking planning by translating historical patterns into forecasts |
| Data Visualization | Ensures insights reach the people who need them in a form they can act on quickly |