
Table of Contents
Introduction: Value Density – The Powerful Engine of Value Delivery
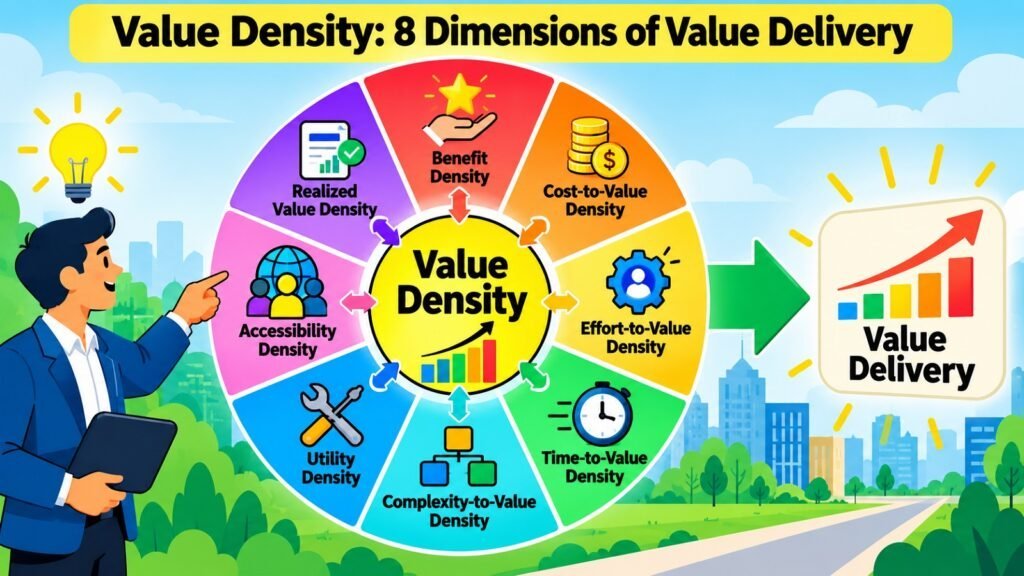
Every product, service, and business offering asks recipients to make sacrifices — money, time, effort, attention, or the willingness to navigate complexity. Value Density captures how much meaningful value they receive in return. It is the concentration of meaningful value within an offering relative to the costs, effort, time, complexity, friction, and other barriers involved in obtaining and realizing that value. When an offering delivers strong, relevant outcomes while requiring minimal unnecessary sacrifice, its Value Density is high. When sacrifices are disproportionate to outcomes, Value Density is weak.
Value Density is an important aspect of Value Delivery. While Value Delivery concerns how organizations create, communicate, distribute, and sustain value across the full customer journey, Value Density examines specifically the concentration and quality of that value relative to what recipients must invest or overcome. Examining this relationship helps organizations understand how effectively an offering converts resources and customer sacrifices into useful outcomes. It is not about adding features, lowering prices, or increasing speed in isolation — each change can help or hurt the ratio depending on whether it strengthens the connection between meaningful outcomes and what recipients must expend to achieve them.
Understanding Value Density also requires a framework for how value progresses from theory to reality. Potential value is what an offering theoretically contains. Accessible value is what recipients can actually reach. Usable value is what they can apply to real tasks. Realized value is what they ultimately benefit from. Each stage introduces opportunities for value leakage, and this article’s framework rests on identifying where that leakage occurs. Eight interconnected dimensions collectively create a multidimensional framework for diagnosing and strengthening Value Density across any product, service, or business model.
A Roadmap of the Eight Aspects of Value Density
| Aspects | Core Focus |
| Benefit Density | Concentration of meaningful, relevant benefits in an offering |
| Cost-to-Value Density | Ratio of meaningful outcomes to total economic sacrifice |
| Effort-to-Value Density | Value obtained relative to effort required to access and use an offering |
| Time-to-Value Density | Speed at which meaningful value is realized without compromising quality |
| Complexity-to-Value Density | Meaningful value provided relative to complexity recipients must manage |
| Utility Density | Degree to which capabilities translate into practical, usable value |
| Accessibility Density | Extent to which meaningful value can be reached by its intended recipients |
| Realized Value Density | Degree to which potential value becomes actual, sustained, outcome-producing value |
1. Benefit Density — Value Density Through Meaningful Benefits
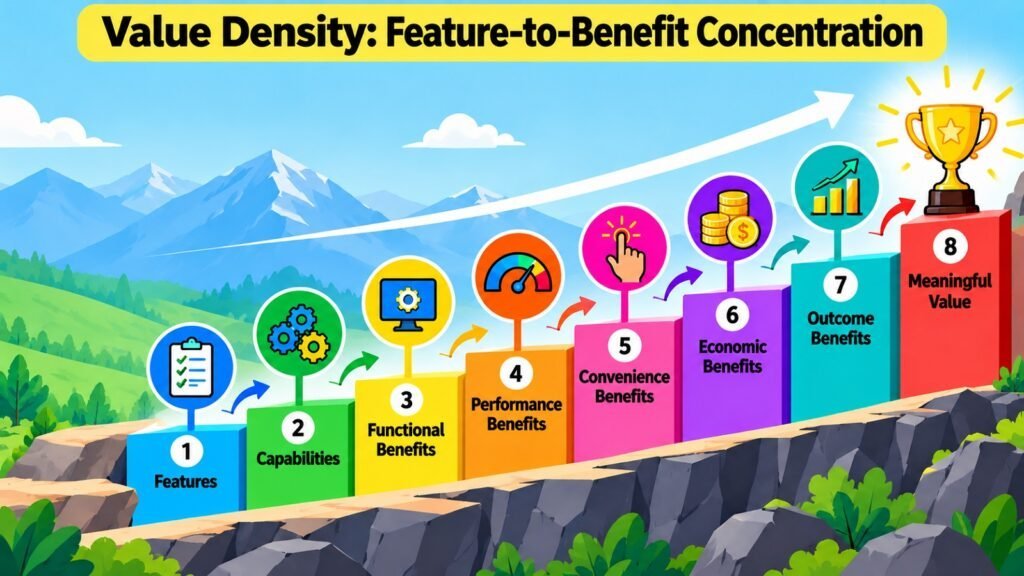
Benefit Density is the most fundamental dimension of Value Density. It refers to the concentration of meaningful, relevant benefits within an offering — specifically, benefits that contribute to outcomes the intended recipient genuinely cares about. The central question is whether those benefits translate into experiences, improvements, or results that matter to real users in real contexts, rather than simply cataloguing how many features or advantages are present.
The distinction between feature quantity and meaningful benefit concentration is critical. Adding capabilities increases an offering’s theoretical scope but does not automatically increase Value Density. Research on product design and user behavior consistently shows that most users engage with a fraction of available features. A Harvard Business School study on feature adoption found that average users of complex software products engage with fewer than 20 percent of features regularly. Each unused feature adds cognitive load and distracts from capabilities that actually deliver value, reducing effective Benefit Density even as it raises theoretical scope.
The key diagnostic questions are: Which benefits do recipients use most frequently and which produce the most meaningful outcomes? Which add capability without adding useful value? Apple’s original iPhone design answers these questions concretely — it removed features deliberately but concentrated remaining benefits around a small number of high-relevance outcomes, producing strong Benefit Density despite fewer total capabilities than many competitors. Trade-offs are real: adding a benefit that increases functionality can simultaneously raise complexity or learning time, reducing overall Value Density. These questions help organizations concentrate investment on the benefits that most strengthen Benefit Density and Value Delivery.
Benefit Density Patterns and Their Impact on Value Density
| Benefit Pattern | Implications |
| Apple iPhone (2007) — removed features, concentrated high-impact benefits | High Benefit Density achieved through deliberate reduction, not addition |
| Microsoft Office feature bloat — most users engage with under 20% of tools | Low Benefit Density when capability exceeds meaningful user engagement |
| Spotify Discover Weekly — personalized benefit concentration | Increases Benefit Density by surfacing relevant content rather than the full catalog |
| Amazon Prime — bundled functional, economic, and convenience benefits | Strong Benefit Density from concentrating multiple high-use benefit types |
| Complex enterprise CRM — extensive features, low adoption rates | Theoretical capability overpowers realized Benefit Density |
| Dyson vacuum — performance benefit concentrated in suction reliability | Focused functional benefit drives high perceived and realized Value Density |
| Notion — flexible workspace but steep learning curve | Benefit Density varies sharply by user sophistication and use-case fit |
| Tesla Autopilot — concentrated safety and convenience benefits | High Benefit Density for frequent highway drivers; lower for urban-only users |
2. Cost-to-Value Density — Value Density Through Economic Value
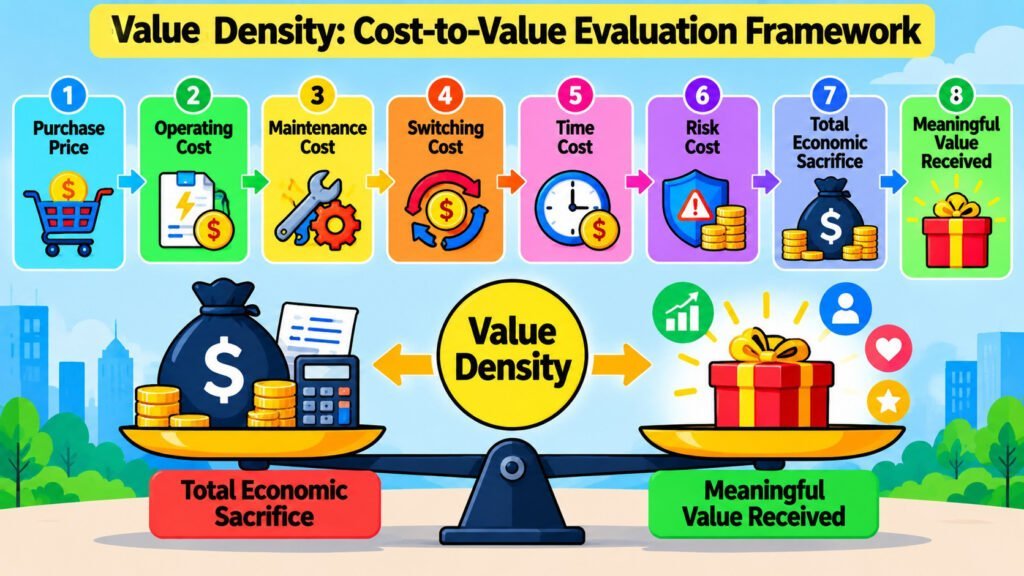
Cost-to-Value Density examines the relationship between meaningful value and the monetary sacrifices required to obtain, operate, and sustain an offering. It is not a synonym for affordability or low price. A premium offering can deliver strong Cost-to-Value Density when its meaningful outcomes substantially justify total economic cost. A low-priced product can produce weak Cost-to-Value Density when quality or realized outcomes fall short of what the customer genuinely needs.
The scope of economic sacrifice extends well beyond the initial purchase price. Total cost of ownership includes installation, configuration, training, maintenance, consumables, support, and replacement costs. Switching costs — the expense and disruption of moving to an alternative — can lock customers into arrangements where the ongoing economic burden exceeds realized value. McKinsey research on B2B pricing found that companies aligning pricing with demonstrated customer outcomes achieve significantly higher retention and willingness to pay than those pricing primarily on cost or competitive parity, supporting the view that Cost-to-Value Density is a legitimate basis for pricing strategy.
Organizations can strengthen Cost-to-Value Density by increasing meaningful outcomes without raising price, reducing unnecessary operating costs, improving durability, or designing pricing around delivered outcomes — pay-per-use, outcome-based fees, or freemium structures. The critical trade-off is that reducing price can weaken quality, support, or long-term reliability, reducing the value side of the ratio. Evaluating this dimension alongside the others ensures economic sacrifice is assessed within the full Value Density framework rather than treated as a standalone metric.
Cost-to-Value Density: Economic Factors and Their Effect on Value Density
| Economic Factor | Effects |
| Total cost of ownership (TCO) vs. purchase price | Hidden costs reduce Cost-to-Value Density even when the headline price is competitive |
| Outcome-based pricing (e.g., SaaS per-seat vs. per-outcome) | Aligns economic structure with realized value, directly strengthening density |
| High switching costs | Lock-in can sustain weak Cost-to-Value Density beyond its natural lifespan |
| Subscription compounding over time | Cumulative cost erodes Cost-to-Value Density if outcomes plateau or decline |
| Premium pricing with high durability (e.g., Patagonia gear) | Higher price justified by extended value realization; strong density over lifecycle |
| Budget products with high failure rates | Low purchase price offset by replacement and lost-productivity costs |
| Freemium model (e.g., Dropbox, Notion) | Low acquisition cost with strong initial density; conversion depends on demonstrating incremental value |
| Volume discounts tied to usage growth | Improves density for high-usage customers; may reduce it for low-usage segments |
3. Effort-to-Value Density — Value Density Through Reduced Customer Effort
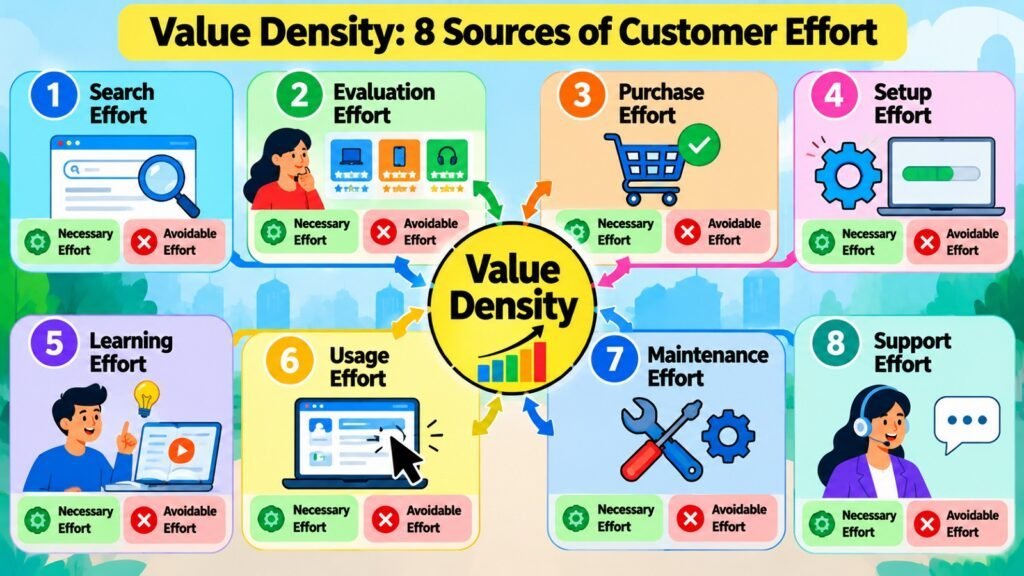
Effort is one of the most underappreciated determinants of Value Density. Effort-to-Value Density captures the relationship between meaningful value and the physical, cognitive, procedural, and behavioral effort recipients must expend to access, purchase, learn, operate, or benefit from an offering. When effort is proportionate to meaningful outcomes, Value Density remains intact. When it is excessive, the offering becomes a burden rather than an asset.
Research published in the Harvard Business Review in 2010 established that reducing customer effort correlates more strongly with loyalty than satisfaction or delight scores alone — reframing effort as a strategic determinant of realized value. However, productive effort must be distinguished from unnecessary friction. Some effort is intrinsic to meaningful value: a patient in physical therapy benefits because the effort contributes to the outcome. The analytical target is always the unnecessary variety — steps, forms, repetitions, and waits that consume recipient energy without contributing to meaningful outcomes.
Digital banks such as Monzo reduced account-opening effort from multiple branch visits over several days to minutes on a smartphone. Amazon’s saved payment details eliminate procedural friction at the transaction point. Automated workflows in enterprise systems reclaim human attention for judgment-intensive work. Diagnostic questions include: Where do recipients abandon processes? Which steps are repeated unnecessarily? Which information requirements improve nothing for the recipient? Reducing these friction points directly raises Effort-to-Value Density and strengthens Value Delivery.
Effort-to-Value Density: Sources of Effort and Opportunities for Improvement
| Effort Source | Opportunities |
| Complex onboarding flows (e.g., lengthy SaaS setup) | Streamline to first meaningful outcome; reduce configuration before value is demonstrated |
| Multi-step checkout processes (e.g., e-commerce) | Amazon one-click model shows significant conversion and density improvement |
| Repetitive data entry across touchpoints | Pre-fill, sync, or eliminate redundant input fields to reduce cognitive and procedural load |
| Dense instruction manuals and help documentation | Contextual in-app guidance reduces learning effort and time-to-usable-value |
| High administrative burden in healthcare (prior authorizations) | Digital pre-authorization reduces provider effort; improves access to realized value |
| Complex IVR phone systems for customer service | Self-service alternatives and callback options reduce effort without reducing resolution quality |
| Manual reconciliation in financial software | Bank feed automation eliminates repetitive tasks; reclaims time as value |
| Lengthy procurement processes in B2B purchasing | Vendor portals and e-procurement reduce procedural friction and shorten decision cycles |
4. Time-to-Value Density — Value Density Through Faster Value Realization
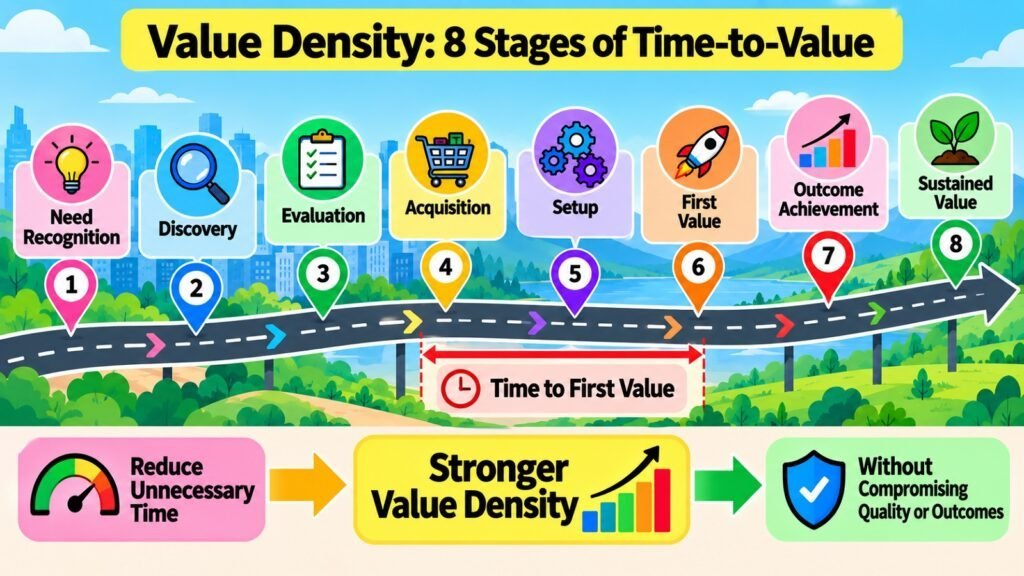
Time is a sacrifice that recipients make in every interaction with an offering, and its distribution profoundly influences Value Density. Time-to-Value Density examines how quickly recipients can begin receiving and ultimately realize meaningful value. This includes waiting periods before use, implementation time, learning curves, delivery time, and the delay between initial adoption and first meaningful outcome.
Research from product analytics firms consistently shows that users experiencing meaningful value within the first few days of adoption are significantly more likely to remain active and convert to paid tiers. Healthcare providers implementing digital triage reduce time between patient contact and initial clinical action. Financial services institutions offering instant digital decisions compress waiting periods that historically created value leakage. Educational platforms using adaptive learning improve the ratio between time invested and learning outcomes achieved.
Expedited delivery does not constitute an inherent benefit: pursuing velocity without consideration for output quality may diminish Value Density despite reducing temporal delays. A logistics enterprise that completes delivery within two days rather than five establishes superior Time-to-Value Density exclusively when merchandise arrives in intact condition and fulfills specifications accurately. The fundamental objective is to eliminate superfluous delays while maintaining substantive value—not to prioritize speed as a standalone objective. Diagnostic inquiries: At which points do recipients experience the most prolonged waiting periods? Does this waiting period contribute meaningful value, or does it represent purely procedural delay? What duration elapses before a new recipient achieves their first significant outcome?
Time-to-Value Density: Key Time Factors and Their Implications
| Time Factor | Implications |
| Onboarding-to-first-value delay (e.g., SaaS) | Longer gaps increase churn risk; first meaningful outcome within 24–72 hours strengthens retention |
| E-commerce delivery time (e.g., Amazon Prime same-day) | Faster fulfillment increases temporal density when quality and accuracy are preserved |
| Loan application decision time (traditional vs. digital lenders) | Digital instant decisions dramatically compress time-to-value without reducing quality |
| Healthcare appointment wait times | Delays between symptom onset and care reduce realized Value Density for time-sensitive conditions |
| Software implementation timelines (months vs. days) | Extended implementations defer return on investment and erode Time-to-Value Density |
| Learning curve for new tools (e.g., enterprise ERP) | Steep curves defer usable value; progressive disclosure and guided paths improve density |
| Streaming platform availability (e.g., day-and-date releases) | Immediate access removes delay between intent and consumption, strengthening temporal density |
| Financial report generation (manual vs. automated) | Automation compresses reporting cycles; faster insight improves decision-making value |
5. Complexity-to-Value Density — Value Density Through Simplicity and Clarity
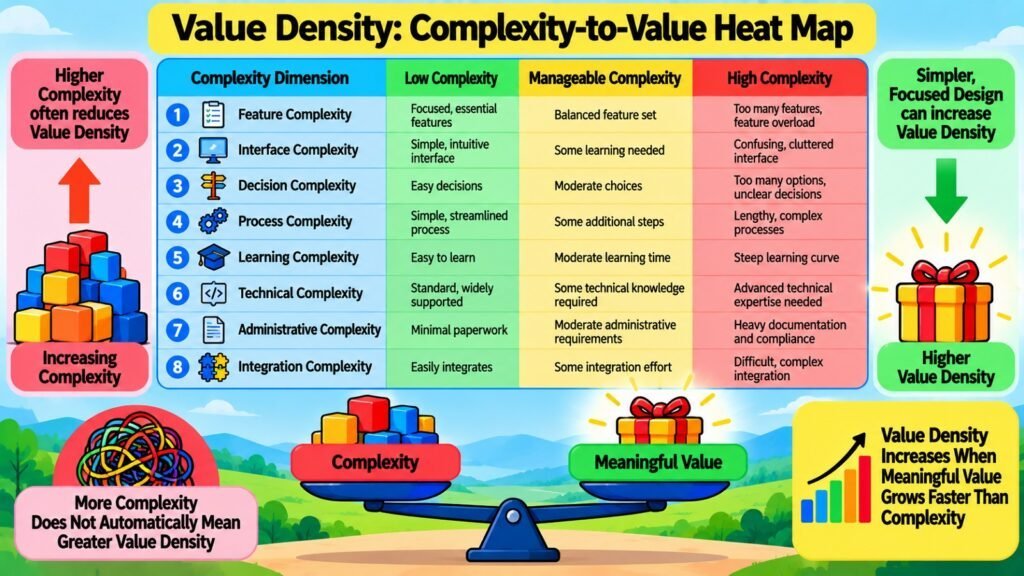
Complexity is a pervasive but often invisible tax on Value Density. Complexity-to-Value Density describes the meaningful value an offering provides relative to the complexity recipients must understand, navigate, or tolerate to obtain it. This applies across product, interface, decision, process, technical, and organizational complexity — each placing cognitive and operational demands on recipients that can erode realized value. George Miller’s foundational research on cognitive load established that working memory has strict limits, and any offering demanding more than recipients can handle will see realized Value Density fall below potential.
The relationship between complexity and value is not uniformly negative. Complexity corresponding to genuinely difficult problems — a surgical tool, a financial modelling system, an advanced engineering platform — is legitimate and necessary. The challenge is distinguishing complexity that reflects meaningful capability from complexity reflecting poor design. Technology companies have addressed this through a core principle: sophisticated capability hidden behind simple interfaces. Apple’s iOS is the canonical example. Iyengar and Lepper’s research on choice overload further showed that too many options reduce purchase likelihood and satisfaction, reinforcing that simpler choice architecture can itself increase Value Density.
The trade-off between flexibility and simplicity is real. Removing options can constrain customization and reduce density for power users even as it improves density for casual users. Managing this requires understanding which user segments drive the most meaningful outcomes. Diagnostic questions include: Which aspects confuse recipients most? Is that confusion necessary or removable? What would happen to meaningful outcomes if this complexity were eliminated? The goal is always a stronger relationship between the complexity that remains and the outcomes it enables.
Types of Complexity and Their Challenges
| Complexity Type | Challenges |
| Interface complexity (e.g., legacy banking systems) | Reduces usable value density by requiring technical skill to access basic functions |
| Decision complexity (e.g., excessive plan tiers in telecom) | Choice overload reduces purchase likelihood and satisfaction with outcomes |
| Process complexity (e.g., multi-step enterprise procurement) | Administrative burden increases effort and delay between intent and value realization |
| Technical complexity (e.g., complex API integrations) | Raises barriers to adoption; limits density to recipients with technical capability |
| Product complexity (e.g., enterprise ERP with hundreds of modules) | Mismatch between available capability and recipient utilization reduces Utility Density |
| Organizational complexity (e.g., fragmented customer service routing) | Recipients navigate internal silos; increases effort without adding value |
| Pricing complexity (e.g., airline fare structures) | Opaque pricing increases cognitive burden and reduces confidence at decision point |
| Language complexity (e.g., legal or medical documentation) | Dense terminology restricts accessible value density to specialist audiences only |
6. Utility Density — Value Density Through Practical Usefulness
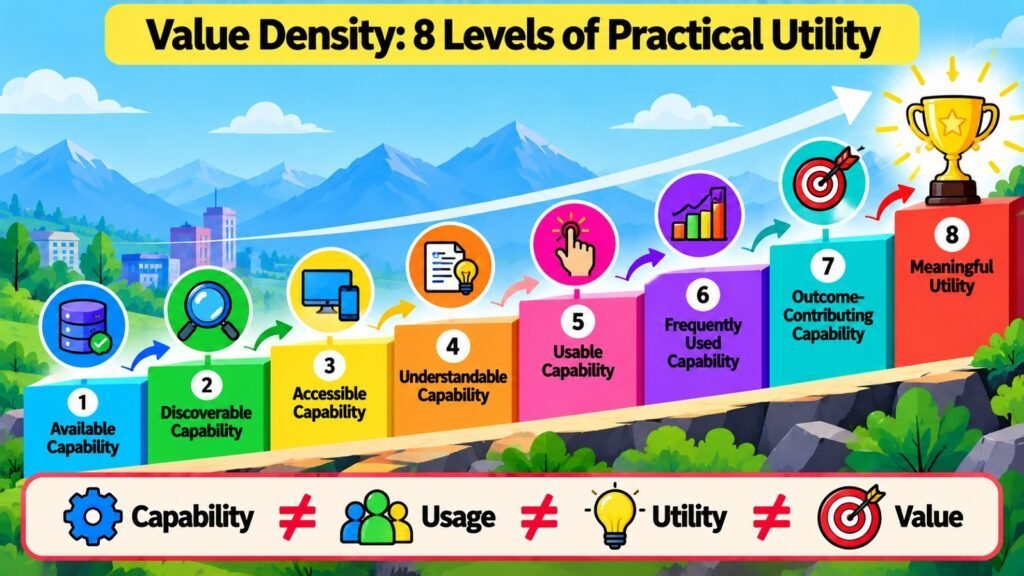
Utility Density addresses the gap between what an offering theoretically can do and what recipients actually find useful in practice. It refers to the degree to which capabilities within an offering translate into practical, meaningful usefulness for intended recipients. An offering can be technically impressive and well-designed yet produce low Utility Density if much of its functionality remains unused, inaccessible, or difficult to apply to the tasks recipients genuinely need to accomplish.
This gap is commercially significant. Microsoft’s research on Office usage patterns showed that the vast majority of users never engage with most available features. Gartner has consistently reported that a significant proportion of enterprise software capabilities purchased are never activated. Frequency of use is the key indicator: capabilities used regularly in meaningful contexts contribute strongly to Utility Density, while rarely used capabilities contribute proportionally less regardless of their sophistication. Reliability matters equally — a capability working predictably under real conditions produces more usable value than one performing well only in controlled settings, and versatility across multiple common tasks produces more Utility Density than coverage of a single rare scenario.
Organizations can improve Utility Density through capability prioritization, personalization, improved usability, integration with tools recipients already use, and customer success programs that help recipients discover and apply overlooked capabilities. The central diagnostic questions are: Which capabilities do recipients use most and least? Is the low use caused by a discoverability problem, a relevance problem, a complexity problem, or a fit problem? These questions direct investment toward the capabilities most responsible for converting potential value into practical, realized value.
Utility Density Dimensions: How Practical Usefulness Determines Value Density
| Utility Dimension | Meaning |
| Feature adoption rate (e.g., Office 365 core vs. advanced tools) | Low adoption signals a gap between capability and usable value; Utility Density is constrained |
| Reliability under real conditions (e.g., navigation apps in low connectivity) | Unreliable capability reduces practical usefulness regardless of technical specification |
| Task relevance (e.g., CRM tools matched to daily sales workflows) | High relevance increases frequency of use and directly strengthens Utility Density |
| Integration with existing tools (e.g., Slack + project management) | Seamless integration extends usefulness into broader work contexts |
| Discoverability of features (e.g., hidden settings in complex software) | Undiscovered capability cannot contribute to Utility Density; surfacing it improves realized value |
| Personalization (e.g., Netflix recommendation engine) | Surfaces the most relevant content or capability for each user’s specific context |
| Versatility across use cases (e.g., Notion for notes, wikis, databases) | Broader legitimate applicability increases Utility Density across diverse recipients |
| Onboarding quality (e.g., guided setup flows in productivity apps) | Better onboarding accelerates users to high-utility features, raising realized Utility Density |
7. Accessibility Density — Value Density Through Reachable Value
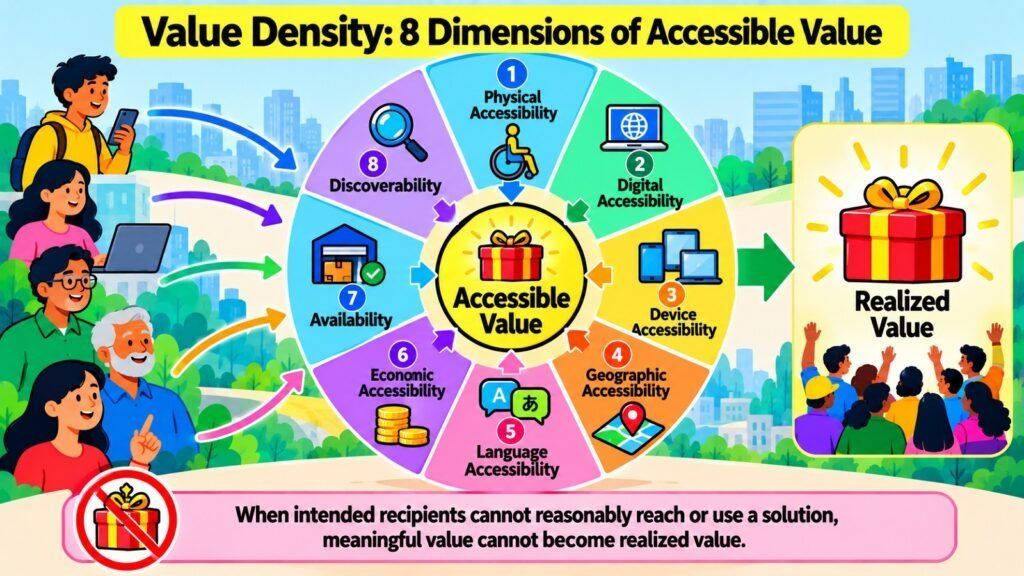
An offering rich with well-designed value can still fail to produce strong Value Density for large segments of its intended audience if that value cannot be reached. Accessibility Density is the extent to which meaningful value embedded within an offering can actually be accessed, understood, and used by its intended recipients. The central principle is direct: value that cannot be accessed cannot be realized. Every barrier between a recipient and meaningful value represents a reduction in effective Value Density.
Accessibility barriers take many forms. Physical accessibility concerns whether recipients with mobility, sensory, or motor impairments can engage effectively. Digital accessibility concerns whether an interface is compatible with assistive technologies such as screen readers, voice navigation, or high-contrast displays. The Web Content Accessibility Guidelines (WCAG) establish specific criteria for digital accessibility, widely adopted as a technical standard and incorporated into law in many jurisdictions. Geographic availability, language, and technological access create further barriers: a digital financial service requiring a smartphone and reliable broadband excludes recipients in low-connectivity regions, and a health platform available only in English creates barriers for speakers of other languages.
Affordability operates as an accessibility barrier distinct from Cost-to-Value Density. While Cost-to-Value Density asks whether price is proportionate to outcomes received by those who can afford it, Accessibility Density asks whether price itself prevents meaningful segments from reaching the value at all. Tiered pricing, subsidized access, freemium models, and community licensing address this barrier directly. Diagnostic questions: Who among the intended audience cannot currently reach the value, and why? Which barriers — physical, digital, geographic, linguistic, or economic — prevent access? Reducing them does not merely expand market reach; it fulfills more of the value the offering already contains.
Accessibility Density Dimensions: How Reachability Shapes Value Density
| Accessibility Dimension | Implications |
| WCAG 2.1 compliance for digital products | Screen reader and keyboard compatibility expands accessible value for users with disabilities |
| Multilingual support (e.g., government services, global SaaS) | Language barriers restrict value reach; native-language access improves Accessibility Density |
| Mobile-first design in low-income markets (e.g., M-Pesa in Kenya) | Smartphone access enables financial value where traditional banking infrastructure is absent |
| Geographic availability (e.g., streaming rights by region) | Content licensing gaps reduce Accessibility Density for out-of-region recipients |
| Offline functionality (e.g., apps with offline modes) | Improves access in low-connectivity environments; sustains usable value density |
| Affordability tiers and subsidy programs (e.g., Spotify student plans) | Reduces price barrier; expands the population that can reach the offering’s value |
| Plain language in legal, healthcare, and financial documents | Reduces literacy and comprehension barriers; improves accessible value for general audiences |
| Physical store accessibility (e.g., ADA-compliant retail environments) | Ensures physical access for recipients with mobility limitations; prevents value exclusion |
8. Realized Value Density — Value Density Through Actual Value Realization
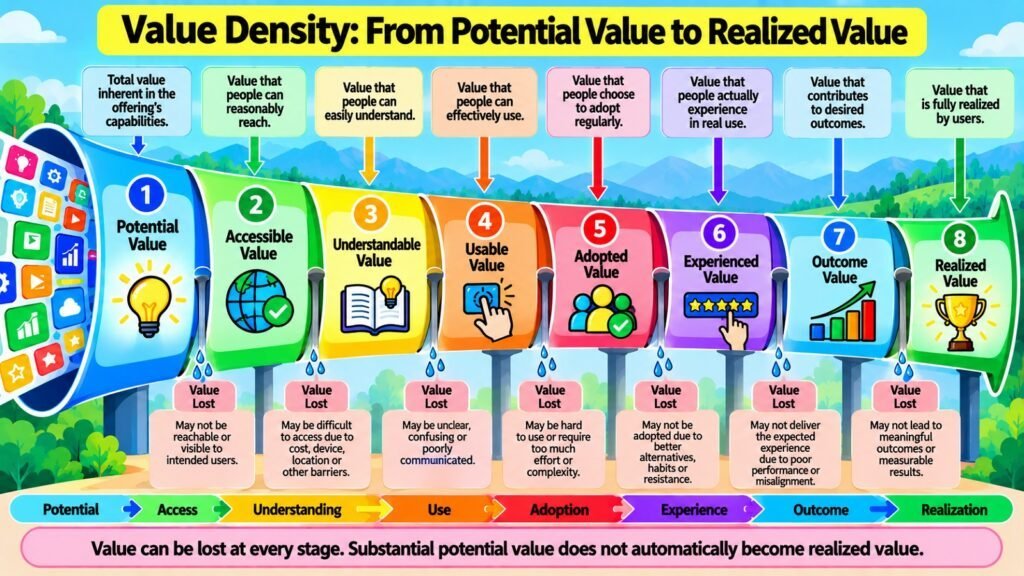
Realized Value Density is the dimension that ultimately determines whether the entire Value Density framework produces anything meaningful. It refers to the degree to which the potential value within an offering becomes actual, experienced, sustained, and outcome-producing value for recipients. Every other dimension — benefits, cost, effort, time, complexity, utility, and accessibility — creates the conditions for realization. Realization itself requires a further step: recipients must engage with the offering, use it effectively, and achieve the outcomes it was designed to produce.
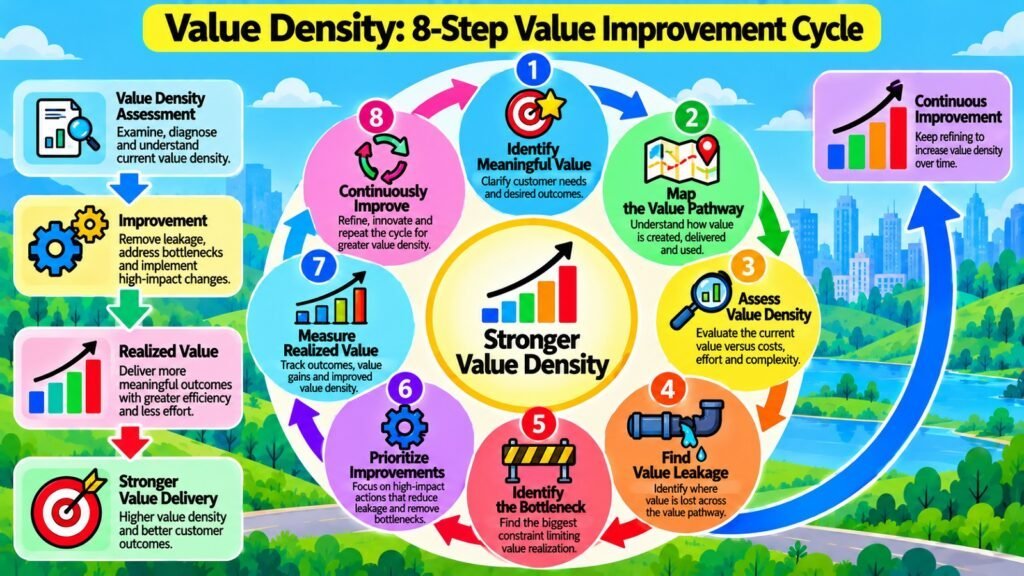
This article introduces the concept of a Value Density bottleneck as a practical analytical principle: in any multidimensional framework, one weak critical dimension can constrain the total value that is ultimately realized, regardless of how strongly the other dimensions perform. An offering with excellent Benefit Density, strong Cost-to-Value Density, low effort, fast delivery, and manageable complexity can still produce weak Realized Value Density if its Accessibility Density is insufficient. Gainsight research on SaaS customer success consistently finds that churn correlates more strongly with failure to realize expected outcomes than with dissatisfaction over features or price — reinforcing realization as the decisive measure of Value Density.
The bottleneck principle gives organizations a diagnostic priority: identify the dimension whose weakness most constrains realized outcomes and address that first. Practical diagnostic questions include: What percentage of recipients achieve the outcomes the offering was designed to produce? Where in the adoption cycle do recipients disengage before realizing full value? What are the most common barriers between early engagement and sustained outcome production? These questions move Value Density analysis from the theoretical to the operational, providing a framework for closing the gap between potential and realized value.
Stages and Challenges in Moving from Potential to Realized Value
| Value Stage | Realization Challenge |
| Awareness to adoption | Recipients who never begin the adoption journey cannot access any value; awareness gaps reduce density from the outset |
| Onboarding to first meaningful use | Complex or unintuitive onboarding causes early dropout before any meaningful outcome is experienced |
| First use to habitual engagement | Without behavioral reinforcement or demonstrated value, early engagement does not convert to sustained use |
| Habitual engagement to full capability use | Most recipients never reach full capability utilization; feature discovery gaps create persistent Utility Density deficits |
| Capability use to goal achievement | Using features is not the same as achieving goals; misalignment between capability and real need prevents realization |
| Goal achievement to sustained outcomes | Outcomes achieved once but not sustained represent temporary rather than realized Value Density |
| Sustained outcomes to perceived value | Recipients may not attribute outcomes to the offering; without perceived credit, willingness to renew declines |
| Perceived value to advocacy and renewal | Realized value not communicated or reinforced by the provider fails to anchor the recipient’s value narrative |
Conclusion: Value Density – A Powerful Foundation of Value Delivery
Value Density is an important aspect of Value Delivery because it provides a disciplined way to examine how much meaningful value recipients can obtain and ultimately realize relative to the costs, effort, time, complexity, accessibility barriers, and other sacrifices the process requires. The eight dimensions — Benefit Density, Cost-to-Value Density, Effort-to-Value Density, Time-to-Value Density, Complexity-to-Value Density, Utility Density, Accessibility Density, and Realized Value Density — are interconnected dimensions of a single analytical framework. Strengthening one without attending to the others can produce gains in some areas while creating new bottlenecks elsewhere.
The distinction between potential, accessible, usable, and realized value underpins the entire framework. Organizations focused exclusively on potential value miss the most strategically important question: how much of that potential actually reaches recipients in a form they can use and benefit from? The Value Density Audit introduced through this framework encourages systematic evaluation of each dimension to identify where value leakage is greatest. The Value Density Scorecard — assigning relative strength to each of the eight dimensions — translates this analysis into a practical prioritization tool built on the bottleneck principle: one or two weak critical dimensions typically constrain the realized Value Density of the entire system. Finding and addressing those dimensions produces a disproportionate improvement in outcomes.
Organizations strengthen Value Delivery not by creating more value in the abstract, but by concentrating meaningful value, making it reachable and usable, reducing unnecessary sacrifices, and ensuring that value is ultimately realized. This is the practical essence of Value Density — and why it deserves a central place in any serious approach to Value Delivery.
Value Density Principles: Core Takeaways from the Value Density Framework
| Principles | Practical Takeaway |
| Concentrate meaningful benefits, not just feature count | Audit which benefits drive real outcomes and cut those that add complexity without proportional value |
| Align price with demonstrated outcomes | Structure pricing around delivered value, not cost or competitive parity; evaluate total cost of ownership |
| Eliminate unnecessary effort at every stage | Map customer effort across the full journey; remove friction that does not contribute to meaningful outcomes |
| Reduce delays between adoption and first meaningful outcome | Prioritize time-to-first-value in onboarding design; every unnecessary day of delay is a density loss |
| Hide necessary complexity; remove unnecessary complexity | Preserve sophisticated capability behind simple interfaces; simplify decision architecture |
| Improve the ratio of capability to actual usefulness | Focus development on high-frequency, high-relevance features; invest in discoverability and onboarding |
| Remove barriers between recipients and meaningful value | Audit physical, digital, linguistic, geographic, and economic access barriers; reduce value exclusion |
| Diagnose and close the potential-to-realized value gap | Use the Value Density bottleneck principle to identify the weakest critical dimension and address it first |