Table of Contents
Introduction: Data Integration and Business Analytics
Organizations generate information across nearly every business function. Customer interactions, transactions, marketing campaigns, financial records, and operational processes each produce datasets that carry potential business intelligence, yet the value of this information often depends on how well it can be connected and understood alongside other sources rather than examined in isolation.
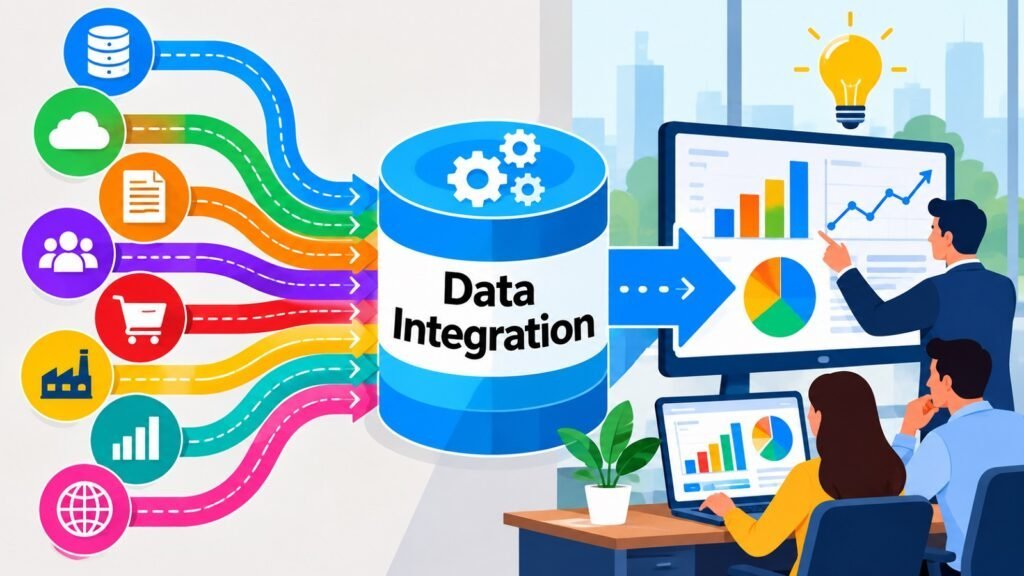
Data Integration is the organizational capability that allows businesses to connect, combine, and unify information from different sources so that related data can be examined together. It is an important aspect of Data Analytics for businesses because analytics becomes more useful when relevant information from different sources can be connected, unified, harmonized, and understood in context.
Data Integration connects and prepares the information environment, while Data Analytics examines that environment to identify patterns, relationships, and insights. Integration without analytics produces connected data with limited immediate use; analytics without integration is constrained to what individual sources can reveal.
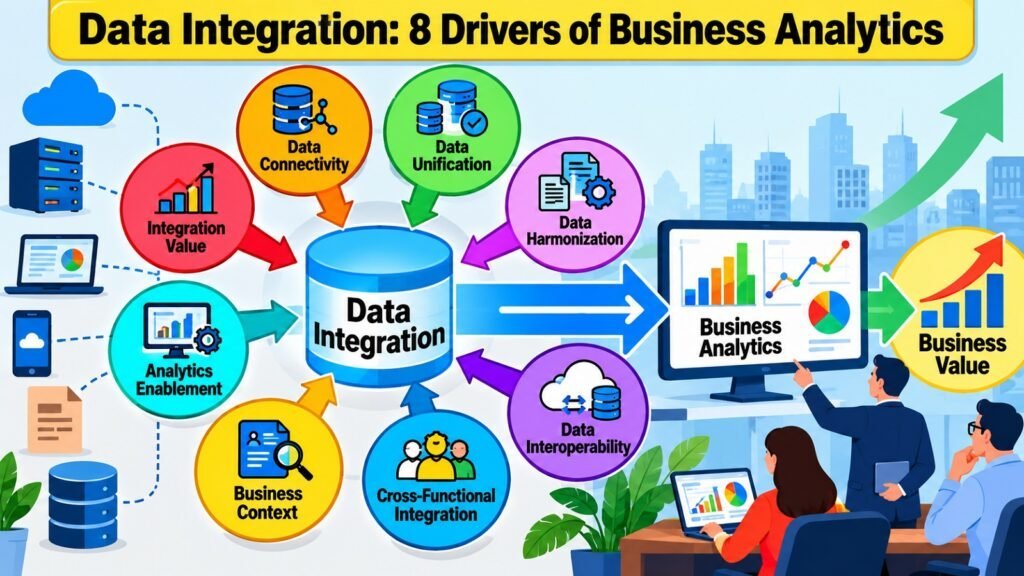
This article examines eight drivers through which Data Integration contributes to Business Analytics: Data Connectivity, Data Unification, Data Harmonization, Data Interoperability, Cross-Functional Integration, Business Context, Analytics Enablement, and Integration Value.
Table 1: Data Integration — Eight Drivers and Their Contribution to Business Analytics
| Data Integration Drivers | Contribution to Data Integration and Business Analytics |
| Data Connectivity | Creates relevant connections between information sources across organizational environments |
| Data Unification | Brings related datasets together to form a coherent view of business activity |
| Data Harmonization | Aligns definitions, formats, and classifications so information from different sources can be compared meaningfully |
| Data Interoperability | Ensures connected environments and information can work together effectively across business boundaries |
| Cross-Functional Integration | Connects information across organizational functions to reveal relationships individual functions cannot see independently |
| Business Context | Preserves the relationships and meaning that make integrated information interpretable rather than merely combined |
| Analytics Enablement | Supports descriptive, diagnostic, and predictive analysis by providing a connected information environment |
| Integration Value | Represents the business benefit created through improved visibility, analytical breadth, and cross-functional understanding |
1. Data Integration: Data Connectivity
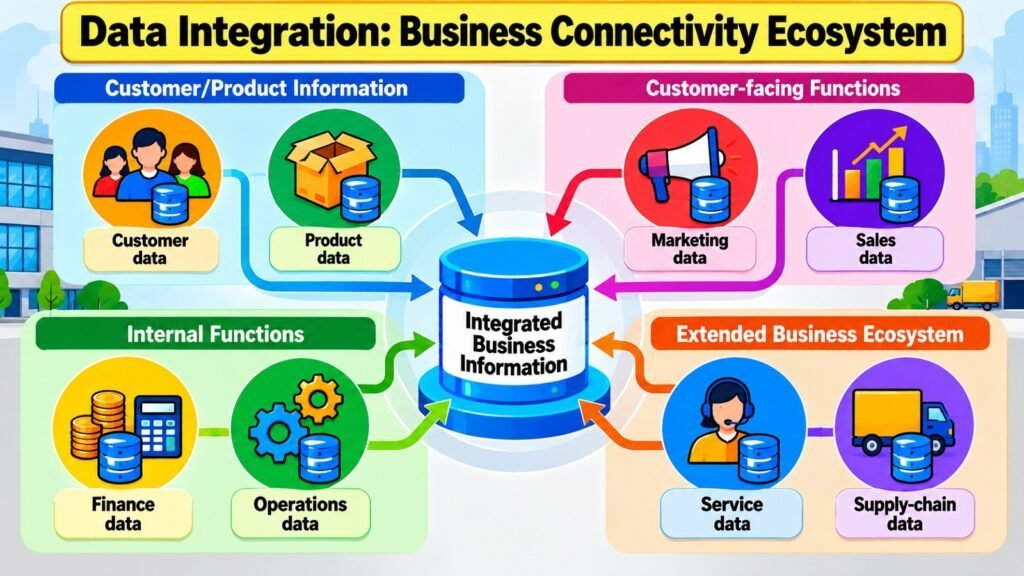
Many organizations hold relevant information that cannot be easily accessed across the boundaries where it would be most useful. A retail business might hold transaction records in one system, customer profiles in another, and product inventory in a third. When these sources cannot communicate, the result is a fragmented picture that limits cross-source analysis.
Data Connectivity is the capability that allows relevant information to become accessible across different sources, systems, environments, and organizational boundaries. It is the starting point for Data Integration because without it, related datasets remain inaccessible to one another regardless of their individual quality.
Disconnected information creates duplicated effort, manual delays, and difficulty tracing relationships across datasets. Connectivity should be distinguished from Data Collection and Data Storage, which concern how information is gathered and retained rather than how it flows between sources.
A common mistake is assuming that connecting two sources automatically produces meaningful integration. Connectivity is a prerequisite, not an outcome. A useful diagnostic is to ask whether relevant information can reach the function where it would be most valuable. If doing so requires manual effort or significant delay, connectivity gaps are limiting the analytical potential of information the organization already holds — and the remaining drivers of Data Integration have no foundation to build on.
Table 2: Data Integration — Common Connectivity Situations and Their Business Implications
| Connectivity Situation | Business Implication |
| Sales and marketing systems have no shared connection | Campaign attribution cannot be linked to actual revenue outcomes |
| Customer service platform is isolated from CRM | Service history is unavailable when analyzing customer retention |
| Finance and operations data are not connected | Cost analysis cannot be aligned with operational activity |
| E-commerce and in-store transaction systems are separate | Customer behavior cannot be examined across channels |
| HR system is not connected to productivity data | Workforce planning lacks insight into output relationships |
| Supplier data is not accessible to procurement analytics | Sourcing decisions are made without complete cost visibility |
| Product and returns data are disconnected | Quality issues cannot be traced to specific product attributes |
| Web analytics and email platform are unconnected | Engagement cannot be linked to downstream conversion behavior |
2. Data Integration: Data Unification
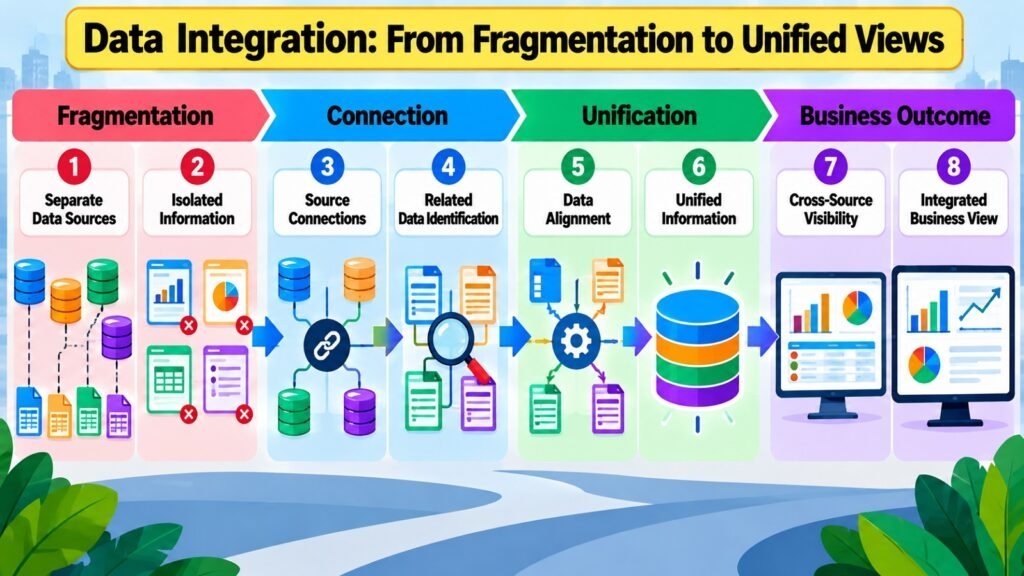
Consider an organization where customer information is held separately by the sales team, the marketing department, and customer service. Each team may have useful records about the same customers, but because those records exist in separate systems with no shared structure, the organization cannot form a complete picture of any individual relationship. The most valuable insights often lie at the intersection of related information rather than within any single source.
Data Unification is the driver concerned with bringing related information together to create a more coherent view of business activity. Connected information still exists as separate datasets; unified information is organized so that related records, attributes, and events can be examined together. Research in information management consistently shows that organizations working from siloed datasets encounter difficulties analyzing customer behavior across the full lifecycle, tracing operational performance across interdependent activities, or assessing financial outcomes in relation to the activities that produced them.
A common mistake is assuming that merging datasets constitutes unification. Simply combining tables without establishing meaningful relationships creates a larger collection of disconnected information rather than a coherent view. Genuine unification requires understanding what information relates to what. Data Unification is also distinct from Data Collection, Data Storage, and Data Quality Management, which address how data is gathered, retained, and validated. A practical diagnostic is to ask whether the organization can trace a single customer, product, or transaction across all relevant systems without significant manual effort.
Table 3: Data Integration — Fragmented Information and the Business Perspective Created Through Data Unification
| Fragmented Information | Business Perspective When Related Information Is Unified |
| Customer profiles in CRM; purchase history in e-commerce system | Complete customer view enables lifetime value and behavior analysis |
| Product specifications in catalog; returns data in service system | Quality and satisfaction can be examined by product attribute |
| Marketing spend in campaign platform; revenue in finance system | Campaign ROI can be calculated and compared across channels |
| Employee records in HR; performance data in operations system | Workforce effectiveness can be related to organizational outcomes |
| Supplier information in procurement; delivery data in logistics | Vendor performance can be assessed across cost and reliability dimensions |
| Web traffic in analytics platform; conversions in sales system | Digital engagement can be connected to commercial outcomes |
| Service tickets in helpdesk; billing records in finance system | Service cost can be analyzed in relation to customer revenue |
| Inventory data in warehouse system; demand data in sales platform | Stock planning can be connected to sales trend information |
3. Data Integration: Data Harmonization
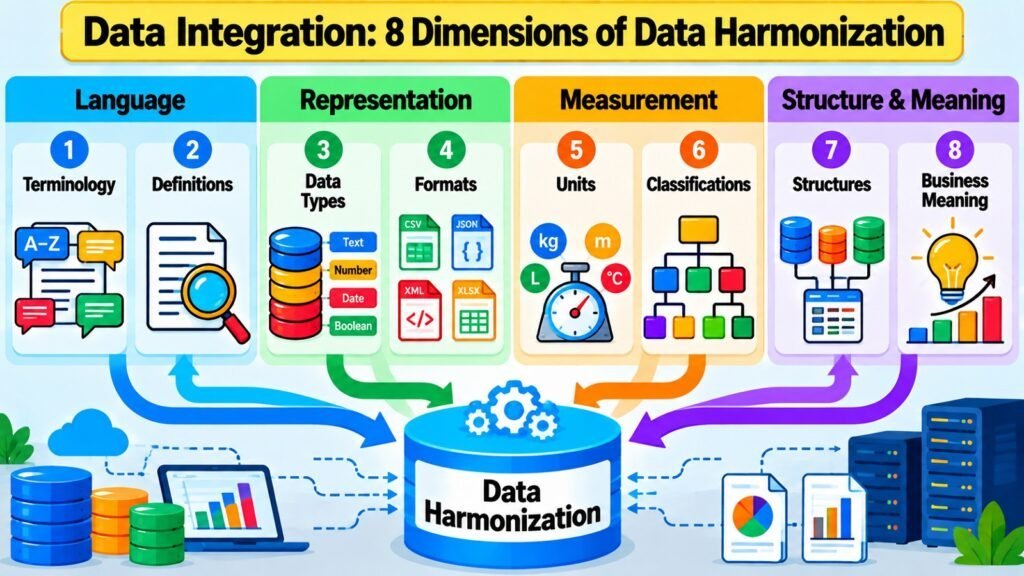
Business functions often develop their own ways of describing shared concepts. A sales team might classify a customer as “active” based on a purchase within the past year, while a marketing team applies the same label to anyone who opened an email in the past ninety days. When these datasets are brought together for analysis, the same term refers to different populations. The result is not integration but confusion masked as completeness.
Data Harmonization is the driver concerned with making different datasets meaningfully comparable and usable together. It addresses the alignment of definitions, classifications, formats, and units so that information from different sources can be examined as part of a coherent whole. The distinction from Data Quality Management is important: data quality concerns whether individual records are accurate, complete, and fit for purpose, whereas harmonization concerns whether datasets from different sources are comparable. A dataset can be internally accurate while still being incompatible with another that uses different terminology or classification structures.
An organization consolidating financial data from regional offices may find that one region records revenue when a contract is signed, another when goods are shipped, and a third when payment is received. Consolidating these records without harmonization produces a misleading financial picture. Gartner and similar research organizations have consistently identified definitional inconsistency as one of the most common barriers to effective cross-source analysis. A practical diagnostic is to ask whether the same business term produces the same result when applied to different datasets. Without harmonization, integration may create the appearance of completeness while embedding definitional inconsistency into the analytical foundation.
Table 4: Data Integration — Differences Between Data Sources and the Business Implications of Data Harmonization
| Difference Between Data Sources | Business Implication of Harmonizing the Difference |
| Revenue recognized at different points across regions | Consolidated financial reporting reflects a consistent performance picture |
| Customer segmentation criteria differ across functions | Cross-functional analysis uses comparable customer groupings |
| Product categories defined differently in sales and inventory | Demand and supply analysis can be aligned by product classification |
| Date formats vary between legacy and modern systems | Time-series analysis can span both systems without conversion errors |
| Currency recorded in different denominations across markets | Global financial comparison becomes accurate and consistent |
| Employee tenure calculated differently across HR regions | Workforce analysis produces comparable figures across geographies |
| Channel definitions differ between marketing and sales teams | Omnichannel performance can be measured without definitional overlap |
| Measurement units differ between product development and manufacturing | Specification and production data can be examined together reliably |
4. Data Integration: Data Interoperability
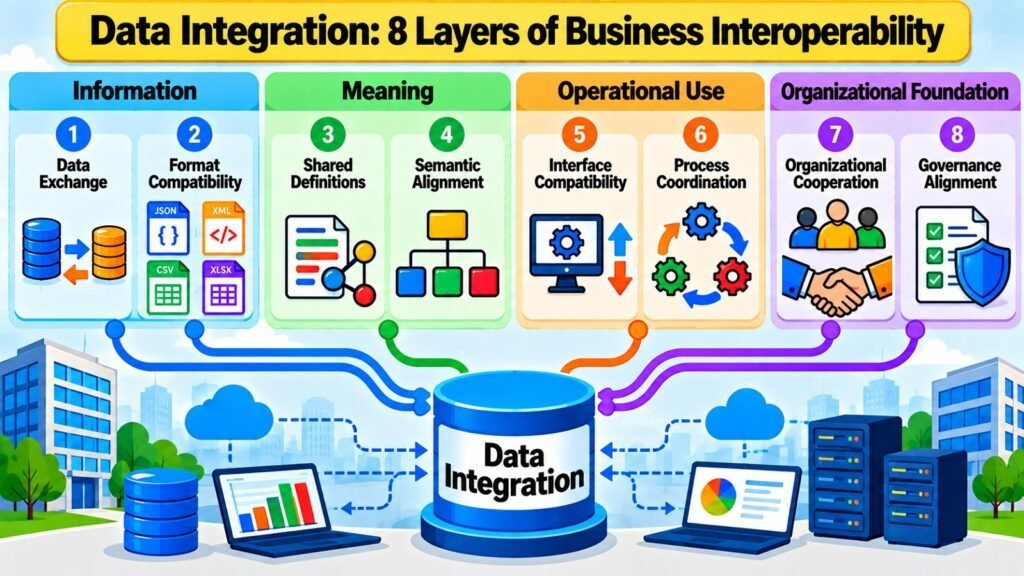
Modern organizations rarely operate within a single, unified technology environment. Most businesses work across multiple applications, platforms, geographic regions, partner organizations, and operational systems developed or adopted independently. Information generated in one environment does not automatically become usable in another, and this is the practical challenge that Data Interoperability directly addresses.
Data Interoperability concerns whether different business environments and information sources can exchange and use information effectively. Connectivity establishes relevant connections between sources; interoperability determines whether connected environments and the information they share can actually work together in practice. A manufacturing company might connect its supplier platform to its procurement system, but if the supplier uses proprietary classification codes while the procurement system relies on internal catalog identifiers, the connection exists without meaningful interoperability. Someone must translate between the two schemes, adding friction and error risk. The International Data Spaces Association and similar bodies have developed frameworks addressing this challenge, recognizing interoperability as a structural issue with significant implications for supply chain analysis, regulatory reporting, and collaborative business intelligence.
A common misconception is that technical connectivity automatically guarantees meaningful interoperability. From an analytics perspective, poor interoperability bounds what integration can achieve: even when data is collected, stored, and connected, analytical teams cannot combine it usefully if information from different sources cannot be interpreted within a common framework. Organizations should ask not only whether their systems are connected but whether information flowing between them can be used effectively without significant manual translation.
Table 5: Data Integration — Interoperability Situations and Their Implications for Business Information Use
| Interoperability Situation | Implication for Business Information Use |
| CRM and ERP systems share a common customer identifier | Sales and financial data can be analyzed together without manual matching |
| Partner systems use proprietary product codes incompatible with internal catalog | Supply chain analysis requires manual translation, introducing delay and error risk |
| Cloud analytics platform cannot consume on-premise database format | Historical data cannot be included in forward-looking analysis |
| Acquired company uses different chart of accounts structure | Consolidated financial reporting requires mapping between two accounting frameworks |
| Mobile app and web platform record events in different schemas | Omnichannel customer behavior analysis requires schema reconciliation |
| Logistics partner transmits data in a format incompatible with internal WMS | Delivery performance cannot be analyzed alongside internal fulfillment data |
| Marketing automation and BI platform share a common data format | Campaign data can be incorporated into enterprise reporting without conversion |
| Regulatory reporting system uses classification codes different from internal taxonomy | Compliance reporting requires reconciliation between internal and regulatory categories |
5. Data Integration: Cross-Functional Integration
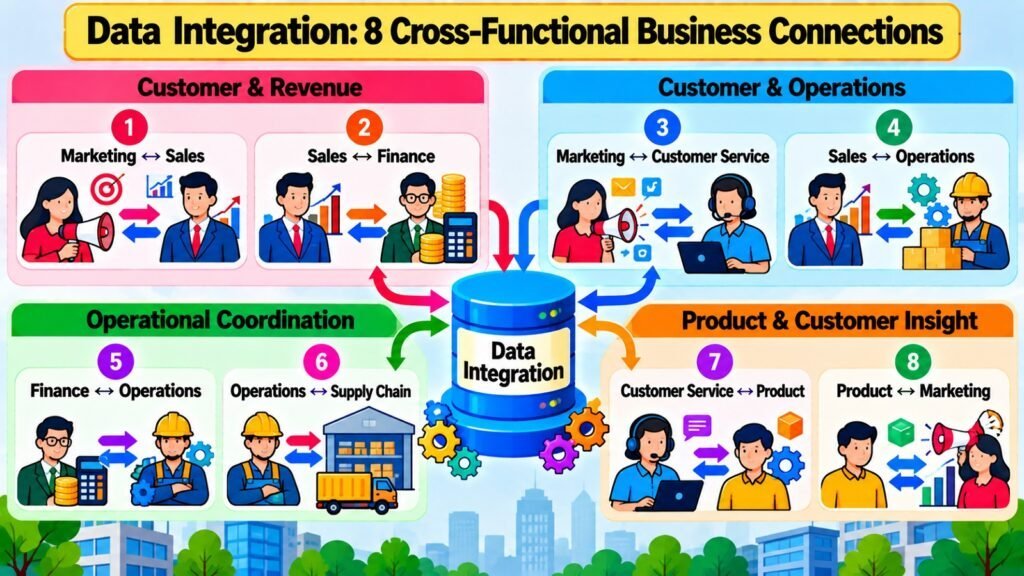
A sales director reviewing declining conversion rates might attribute the problem to ineffective marketing messaging. The marketing team might point to strong top-of-funnel engagement and suggest the issue lies in the sales process. A customer service manager, meanwhile, might note that complaints about product quality have increased. Each interpretation is grounded in genuine information, yet each reflects only what a single function can observe. The full picture requires information that cuts across all three.
Cross-Functional Integration connects relevant information across organizational functions. Marketing, sales, finance, operations, customer service, supply chain, and human resources each generate information that becomes more valuable when relationships across functional boundaries can be examined. Research consistently identifies departmental silos as a structural barrier to integrated business understanding. When information is organized by function rather than by business relationship, the analytical infrastructure reflects departmental boundaries rather than the interconnected nature of business activity. A business seeking to understand customer profitability needs to connect sales revenue from one function with service cost from another and marketing investment from a third.
Practical challenges include inconsistent terminology, incompatible formats, and departmental ownership resistance. A common mistake is assuming all information must be integrated rather than only the information that addresses relevant shared questions. A useful diagnostic is to identify the most important business questions that require information from more than one function. If those questions cannot currently be answered without significant manual effort, cross-functional integration gaps are limiting analytical visibility.
Table 6: Data Integration — Cross-Functional Information Relationships and Their Analytical Relevance
| Cross-Functional Information Relationship | Potential Analytical or Business Relevance |
| Marketing spend connected to sales conversion data | Enables analysis of campaign contribution to revenue by channel |
| Service cost data connected to customer revenue records | Supports calculation of customer profitability across the relationship lifecycle |
| HR data connected to operational productivity metrics | Allows workforce investment to be examined in relation to output |
| Supply chain lead times connected to sales order data | Reveals how supplier performance affects customer order fulfillment rates |
| Finance cost data connected to operations activity records | Supports activity-based costing and process efficiency analysis |
| Product development attributes connected to customer returns data | Links quality issues to specific product characteristics and design decisions |
| Sales pipeline data connected to production planning records | Improves demand visibility and reduces misalignment between commercial and operational plans |
| Customer satisfaction scores connected to service resolution data | Connects resolution quality and speed to downstream satisfaction outcomes |
6. Data Integration: Business Context
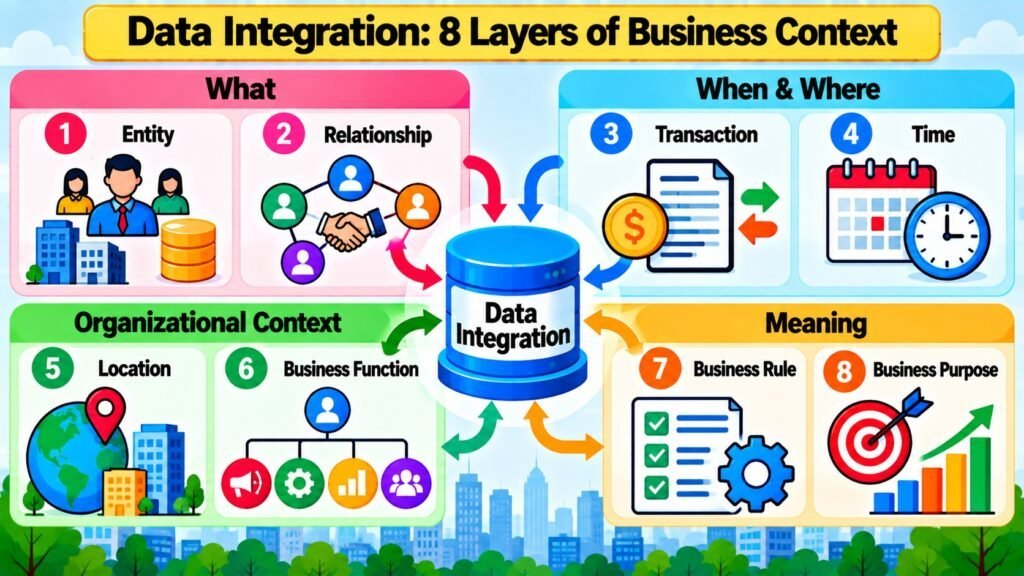
Combining information does not automatically make it meaningful. An organization might connect transaction records, customer profiles, and service interactions into a single environment while still finding the resulting dataset difficult to interpret. The missing element is often context: the relationships, circumstances, and organizational meaning that transform a collection of records into something understandable and usable.
Business Context is a critical driver of Data Integration because connected information becomes more useful when its relationships, meaning, and organizational circumstances remain understandable. A transaction record carries more interpretive value when it is connected to the customer who initiated it, the product it concerned, the campaign that influenced it, and the service interaction that followed. In information management, context is not simply additional data; it is the relational structure that allows data to be interpreted accurately within the circumstances in which it was generated.
A retailer analyzing a spike in product returns might find, without context, simply that return volumes increased during a specific period. With business context, the same dataset might reveal that returns were concentrated among customers who purchased through a specific promotional channel, involving a particular product variant, during a period when a known supply quality issue existed. The numbers are identical in both cases; contextual connections are what make them interpretable. Business Context should be distinguished from Data Intelligence and Decision Intelligence, which concern transforming information and informing decisions. A practical diagnostic is to ask whether someone unfamiliar with a system could draw meaningful conclusions from the integrated data.
Table 7: Data Integration — Forms of Business Context and Why Each Matters for Integrated Information
| Form of Business Context | Why It Matters When Integrating Information |
| Customer relationship history | Allows transactions to be interpreted as part of an ongoing commercial relationship rather than isolated events |
| Organizational hierarchy and reporting structure | Enables financial and operational data to be understood within its management context |
| Product and service classification | Ensures that sales and inventory records can be compared and analyzed within a coherent product framework |
| Campaign and promotional activity records | Connects behavioral data to the commercial activities that may have influenced it |
| Geographic and market context | Allows performance data to be interpreted in relation to the market conditions in which it was generated |
| Operational sequence and process stage | Clarifies where in a business process an event occurred, which affects how it should be interpreted |
| Time period and business cycle | Ensures that analytical comparisons account for seasonality, financial periods, and business cycle effects |
| Regulatory and compliance environment | Provides the framework within which certain business decisions and data classifications were made |
7. Data Integration: Analytics Enablement
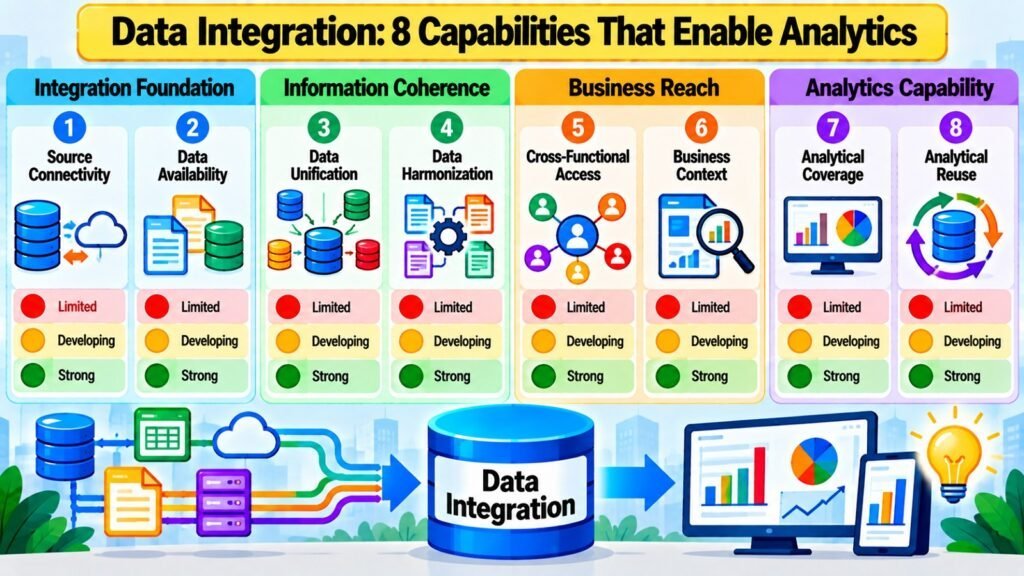
A business operating with fragmented information faces a constrained set of analytical questions. It can examine what each individual source reveals but cannot easily explore what related sources reveal in combination. When information remains siloed, patterns that span multiple datasets stay invisible, and questions that would most benefit from cross-source analysis go unanswered.
Analytics Enablement is the driver that most directly connects Data Integration with Business Analytics. Data Integration does not perform analysis; it prepares and connects the information environment so that analytical activities can draw on a broader, more coherent set of information. Descriptive analytics benefits because it can characterize business activity across multiple dimensions simultaneously. Diagnostic analytics becomes more powerful when integrated information allows analysts to trace causes across functional boundaries. Predictive approaches benefit from integrated historical information that reflects the full complexity of the environment being modeled.
An important limitation is that integration does not guarantee accurate or useful analytical results. Analytical quality also depends on the quality of individual datasets, the appropriateness of methods, and analyst expertise. Integration creates conditions for broader analysis; it does not substitute for the judgment that effective analysis requires. Data Integration is an important enabling aspect of Data Analytics for businesses because it expands the information environment within which analysis can operate. A practical diagnostic is to identify which business questions cannot be answered because the required information spans multiple disconnected sources.
Table 8: Data Integration — Integrated Business Information and the Analytical Questions It Can Help Support
| Integrated Business Information | Types of Analytical Questions It Can Help Support |
| Customer transactions connected to marketing campaign data | Which campaigns contribute to customer acquisition and repeat purchasing? |
| Service interaction records connected to customer revenue data | How does service quality relate to customer retention and lifetime value? |
| Financial cost records connected to operational activity data | Which operational processes contribute most to cost and where do inefficiencies occur? |
| Product returns connected to sales channel and customer segment data | Which customer groups or channels are associated with higher return rates and why? |
| Employee performance connected to training and development records | Which development investments are associated with measurable improvements in output? |
| Supplier performance data connected to internal delivery records | How does supplier reliability affect customer order fulfillment performance? |
| Web behavior data connected to offline purchase records | How do digital engagement patterns relate to in-store or direct purchase decisions? |
| Demand forecasts connected to inventory and production planning data | How accurately does current planning reflect realized demand across product lines? |
8. Data Integration: Integration Value
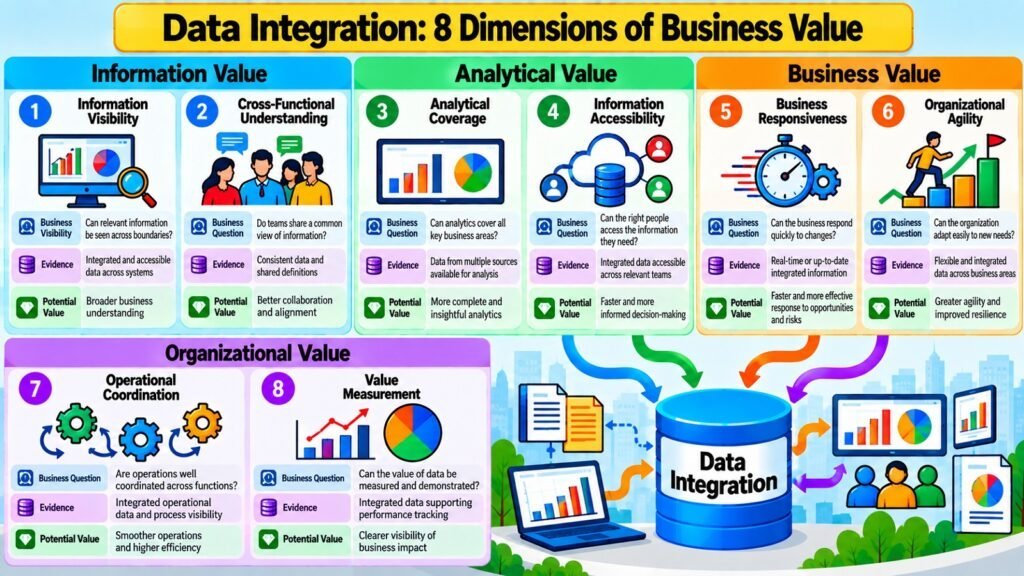
There is a meaningful difference between the activity of connecting information sources and the value those connections can create. Organizations may invest in integration infrastructure, establish technical connections, and achieve unified and harmonized information while still questioning whether the investment has produced tangible benefits. Evaluating integration requires shifting attention from what has been connected to what has become possible as a result.
Integration Value is the business-oriented outcome of effective Data Integration. Value does not arise automatically from connecting information; it emerges when integrated information enables organizations to answer questions they previously could not, recognize patterns they previously could not see, or respond to circumstances more effectively. Key dimensions include analytical visibility, analytical breadth, cross-functional understanding, and organizational agility. Measuring integration value presents practical challenges: attribution is difficult because improved analytical capability is one of several factors influencing business outcomes, and benefits may emerge gradually as analytical processes adapt to a richer information environment.
Research by Deloitte, McKinsey, and similar organizations suggests that businesses investing in integrated information capabilities tend to show improvements in planning accuracy, coordination, and analytical responsiveness, though these findings reflect correlations rather than direct causal claims. Degree of benefit depends on how well integration addresses genuine business needs. A practical assessment is to ask whether Data Integration investment is targeting real information gaps rather than simply connecting available systems because connection is technically possible. Integration Value connects the eight-driver framework back to its fundamental purpose: strengthening the information foundation that Business Analytics depends on.
Table 9: Data Integration — Dimensions Through Which Organizations Can Assess Potential Business Value
| Value Dimension | What to Assess When Evaluating Integration Value |
| Analytical visibility | Has the range of observable business activity expanded as a result of integration? |
| Information access | Can relevant information now be accessed more readily across organizational functions? |
| Analytical breadth | Are analytics teams now able to address a wider range of business questions than before? |
| Cross-functional understanding | Can the organization now examine business relationships that previously required manual effort to explore? |
| Responsiveness | Is the business able to recognize and respond to changing conditions using integrated information more quickly? |
| Planning accuracy | Have demand forecasting, resource planning, or financial projection processes become more reliable? |
| Operational coordination | Has information sharing across departments improved coordination in relevant business processes? |
| Decision support | Are business decisions being informed by a broader and more coherent set of integrated information? |
Conclusion: Data Integration and The Future of Business Analytics
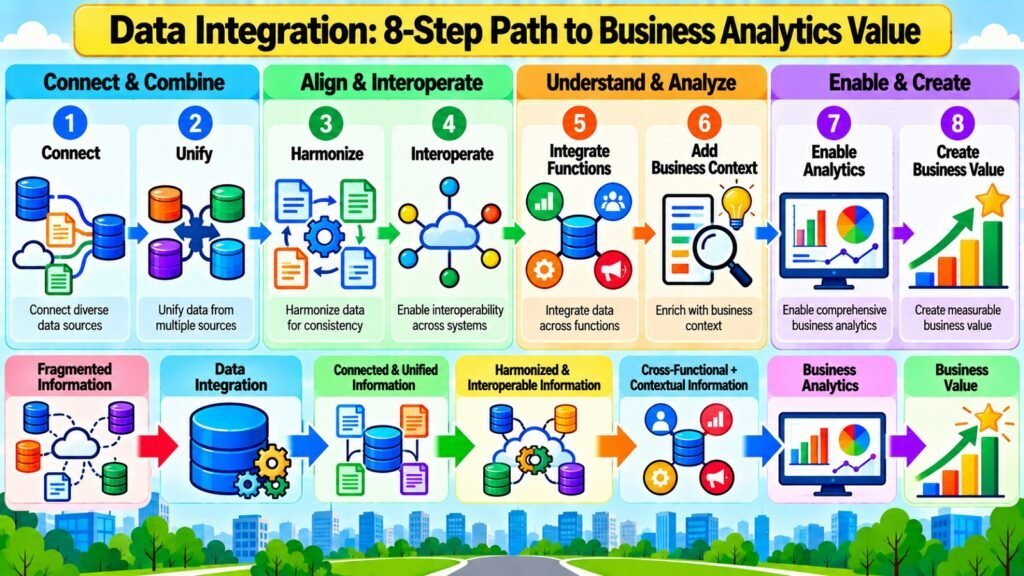
Data Integration is an important aspect of Data Analytics for businesses because it addresses the fundamental problem of fragmented information. Organizations that generate valuable data across customers, products, transactions, finances, and operations still face meaningful limitations when that data cannot be connected and examined as a coherent whole. Integration creates the information environment within which analytics can operate effectively.
Eight drivers examined in this article are interconnected components of a broader organizational capability. Data Connectivity establishes the initial conditions by creating relevant connections between sources. Data Unification brings related datasets into a coherent structure. Data Harmonization ensures information from different sources can be compared meaningfully. Data Interoperability addresses whether connected environments can actually work together. Cross-Functional Integration extends those connections across organizational boundaries. Business Context preserves the relational meaning that makes integrated information interpretable. Analytics Enablement connects the integrated environment to the analytical activities it can support. Integration Value describes the business outcomes that effective integration can help create.
Data Integration should not be confused with Data Quality, Data Governance, Data Analytics, Data Intelligence, or Decision Intelligence. It is an enabling layer that creates conditions for later stages of the data lifecycle to function with a more coherent information base. The most useful evaluation questions are practical: Which business questions cannot be answered because relevant information is disconnected? Where do definitional inconsistencies create barriers to cross-source analysis? Is integrated information retaining enough context to be genuinely useful? Treating Data Integration as a strategic business capability rather than a technical activity is how organizations derive lasting value from the information they already generate.
Table 10: Data Integration — Eight Drivers and Their Broader Contribution to Business-Focused Integration
| Data Integration Drivers | Broader Contribution to Business-Focused Data Integration |
| Data Connectivity | Establishes the foundational access layer that allows related information to flow between sources |
| Data Unification | Creates a coherent view of related business activity from information previously held in separate datasets |
| Data Harmonization | Ensures that cross-source comparisons reflect consistent definitions, units, and classification frameworks |
| Data Interoperability | Allows information to be exchanged and used effectively across different business environments and organizational boundaries |
| Cross-Functional Integration | Connects information across departmental boundaries to reveal relationships no single function could observe independently |
| Business Context | Preserves the relational meaning that allows integrated information to be interpreted accurately within its business circumstances |
| Analytics Enablement | Expands the range of analytical questions that can be addressed by providing a broader and more coherent information environment |
| Integration Value | Represents the observable business benefit created when integration improves visibility, analytical capability, and organizational understanding |